Interpreting manure analysis results
 Print
Print Email
EmailApplying the appropriate amount of manure requires correct interpretation of the manure test results.
Applying the appropriate amount of manure requires correct interpretation of manure test results. Moisture and nutrient levels on the test results need to match crop nutrient needs. Under-application of manure will not meet crop needs and over application may allow excess nutrients to escape into ground or surface water. This article discusses how to interpret manure sample test results.
Manure test results
Basic manure sample test results include moisture, total nitrogen (N), ammonium N, organic N, phosphorus as P2O5 and potassium as K2O. Micronutrients and additional information can also be requested for analysis. For liquid manure, nutrients are often reported in pounds per 1,000 gallons of manure. Solid manure nutrients are reported in pounds per ton of manure. If the manure is not reported in a useable unit, the lab can often convert the report to the desired reporting unit. The exception is moisture, which is only able to be reported as a percentage.
Keeping nitrogen available
Nitrogen is divided into two parts: organic and ammonium. Each reacts differently in the soil once manure is applied. When manure is applied in September through June, only one-third of the organic nitrogen, expressed as organic N, is available. The remaining amount of organic N must be broken down before becoming available, which usually occurs over a three-year period.
Ammonium nitrogen, expressed as NH4, is stable in the soil. However, through a process called nitrification, soil microbes convert ammonium to nitrate which is readily available to the plant but can be lost easily to the environment through volatilization. Therefore, manure applied and left on the soil surface during hot, sunny conditions may lose ammonium, and consequently nitrate N, into the atmosphere. Because of this, nitrogen availability depends heavily on when the manure is applied and how quickly it is incorporated into the soil.
Soil cover created by incorporation provides protection from the sun and reduces runoff loss from rain. Depending on conditions associated with seasonal weather, incorporation timing may be slightly extended before significant nitrogen losses occur. Table 1 provides estimations of nitrogen availability based on timing and incorporation. Applying manure as close to planting or directly to a growing crop will increase the amount of nitrogen utilized by the crop.
Table 1. Estimated nitrogen availability of manure based on time and application method
|
Available Nitrogen Percent |
Time of Application |
Days Until Incorporated |
|
|
Ammonium (NH4) |
Organic N |
Date |
Days |
|
50% |
33% |
Nov-Feb |
Less than 5 |
|
25% |
33% |
Nov-Feb |
More than 5 |
|
50% |
33% |
Mar-April |
Less than 3 |
|
25% |
33% |
Mar-April |
More than 3 |
|
75% |
33% |
April-June |
Less than 1 |
|
25% |
33% |
April-June |
More than 1 |
|
75%* |
15% |
July-Aug |
Less than 1 |
|
25% |
15% |
July-Aug |
More than 1 |
|
25% |
33% |
Sept-Oct |
Less than 1 |
|
15% |
33% |
Sept-Oct |
More than 1 |
Notes:
- The calculations are for all animal manures. It is assumed that 50 percent of the organic N in poultry manure is converted to NH4rapidly and is therefore included in the NH4column for calculating available N.
- Incorporation is the mixing of manure and soil in the tillage layer. Disking is usually enough tillage for conserving nitrogen availability.
- *The 75 percent available nitrogen (NH4) is based on the nitrogen being used in the year it is applied. If the nitrogen is carried over to the following year, then 25 percent available nitrogen estimates should be used.
Phosphorus and potassium (also referred to as potash) are reported on test results as P2O5 and K2O, respectively. The manure sample test reports these nutrients identical to analysis of commercial inorganic fertilizer. Crop nutrient needs can be determined from the Tri-State Fertilizer Recommendations.
Source: Adapted from Ohio State University Extension Bulletin 604, 2006 Edition.
Example of interpreting manure sample test results for crop needs
Below is an example illustrating how to interpret a manure sample test. Having the most recent soil test results is necessary to use along with the manure sample test to accurately determine crop needs. The soil test will contain the current levels of nitrogen, phosphorus and potassium and other nutrients in the field. Additionally, soil cation exchange capacity (CEC) will be listed, which is the ability of the soil to hold and release certain nutrients.
Example: A manure application is being planned for April and will be incorporated in less than one day. The planned crop is corn with a yield goal of 180 bushels per acre and the field has a phosphorus soil test level of 20 pounds per acre or 10 ppm, and a potassium soil test level of 50 pounds per acre or 25 ppm with a CEC of 20 milliequivalents per 100 grams. A manure sample test was completed, and the results are shown below:
Manure Sample Test Results (for example exercise)
|
Analysis |
Percent |
Nutrients (lbs./1,000 gal) |
|
Moisture |
98.61 |
|
|
Nitrogen, Total |
.18 |
15.7 |
|
Nitrogen, Ammonium |
.12 |
10.4 |
|
Nitrogen, Organic |
.06 |
5.2 |
|
Phosphorus (P2O5), Total |
.11 |
9.6 |
|
Potassium (K2O) |
.15 |
13.0 |
First, calculate the amount of ammonium and organic N contained in each 1,000 gallons of manure based on the percentage listed in Table 1 (based on April application with less than one day incorporation):
Ammonium: 10.4 lbs. x 75% = 7.8 lbs.
Organic N: 5.2 lbs. x 33% = 1.7 lbs.
Add ammonium and organic N together for total N:
7.8 lbs. (ammonium) + 1.7 lbs. (organic N) = 9.5 lbs. total N (per 1,000 gallons of manure)
Because phosphorus is the limiting nutrient, we will determine the amount of manure to apply based on the phosphorus recommendation. According to the test results, the manure contains 9.6 pounds of phosphorus (P2O5) for each 1,000 gallons. The amount of phosphorus recommended by the Tri-State Fertilizer Recommendations for corn with a yield goal of 180 bushels per acre is 90 pounds per acre.
Divide the recommended amount of phosphorus (P2O5) per acre by the amount of phosphorus (P2O5) per 1,000 gallons of manure to determine the application rate:
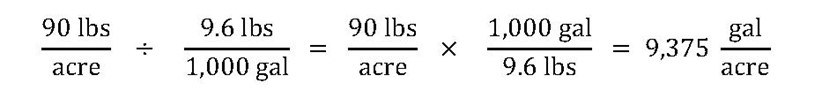
Rate = 9,375 gallons/acre (rounded up to 9,400 gallons/acre)
For practical application purposes, we round up the amount applied per acre to 9,400 gallons/acre. Next, we will determine how much total N will be applied with this application rate. We calculated the manure contains 9.5 pounds of total N per 1,000 gallons of manure. Multiply the amount of total N in the manure by the application rate to determine the amount of total N that will be applied:
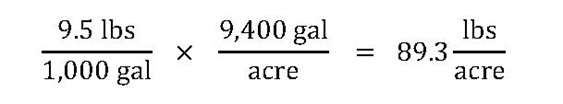
Total N = 89.3 lbs./acre
The Tri-State Fertilizer Recommendation for nitrogen for corn following soybeans with a yield goal of 180 bushels per acre is 190 pounds per acre. Supplemental nitrogen will need to be applied. The same formula can be used to determine potassium levels applied. According to the manure test there is 13 pounds per 1,000 gallons of K2O in this manure. Multiply the K2O in the manure by the application rate to determine the amount of K2O that will be applied:
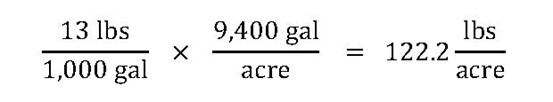
Total K2O = 122.2 lbs./acre
The Tri-State Fertilizer Recommendation for potassium for corn with a yield goal of 180 bushels per acre, 25 ppm and a 20 CEC is 220 pounds per acre. Supplemental potassium will need to be applied.
This story was originally posted by The Ohio State University. It has been modified and reposted with permission to incorporate Michigan-specific information.