An Overview of Farm Labor in Michigan
 Print
Print Email
EmailFor the first time in recent history, the Mexican immigrant population has started to decline, creating new labor supply pressures for industries that rely on immigrant employees.
The farm workforce in Michigan has experienced several changes over the past 20 years. While certain agricultural sectors have adopted new management practices and reduced their reliance on labor, others, such as fruit and vegetable production and the dairy industry, still depend heavily on farm labor. This is primarily due to the unavailability of technology for specific farm tasks, or the high costs associated with implementing robotic or mechanized equipment to replace human labor. However, with the rising pressure on farm profitability due to high wages for farm labor, worker availability, and low returns for raw agricultural products, the agriculture sector is faced with the challenge of finding labor solutions to keep farms in business.
A recent study by Michigan State University indicates that a 10% increase in farm wages in Michigan would lead to a 6.7% decline in farm employment and a 2.7% reduction in specialty crop production (direct effects). The study finds that rising wages would cause regional incomes to rise by $78.2 million, primarily driven by increased labor income. However, their estimates suggest that total regional output would drop by $51.1 million as agricultural producers reduce their production, reflecting a decrease in the value of economic transactions. The study finds that while higher wages may boost overall labor income in the sector, they could also cause lower employment and reduce output.
The farm workforce is evolving as Mexican immigration declines and traditional migrant populations age. The farm labor force in the United States consists mostly of immigrant workers from Mexico, and about half are not legally authorized to work in the U.S. For many decades, the number of Mexican immigrants residing in the U.S steadily increased, reaching more than 11 million in 2007. However, for the first time in recent history, the Mexican immigrant population has started to decline, creating new labor supply pressures for industries that rely on immigrant employees.
Following the trend in Mexican migration, evidence suggests that the supply of U.S.-based farm employees is declining, causing producers to make significant changes to their production and labor management practices. Farmers are using farm labor contractors to bring workers to their farms and are utilizing the H-2A visa program to address labor shortages. Factors that have contributed to the declining farm labor supply include increased educational attainment among rural Mexicans, demand for immigrant workers from competing sectors within the U.S., and a decline in migratory behavior among U.S. farm workers.
Industry sources argue that the H-2A program’s minimum wages, known as Adverse Effect Wage Rates (AEWR), exceed local wages, creating a disconnect from local farm labor conditions. They warn that higher labor costs could drive domestic farm businesses reliant on the H-2A visa program out of business, as they can't pass on these costs to consumers. Competition from countries with lower labor costs also adds pressure to the situation by putting downward pressure on farmgate prices. Despite growth in the H-2A program in the Lake Region, its expansion has slowed, suggesting rising labor costs may be reaching a tipping point. Recently, legislation has been proposed to address some of these labor challenges but has failed to garner sufficient bipartisan support. In this article, we provide an overview of the farm labor market in Michigan, emphasizing changes in employment, wages, and farmworker characteristics to highlight how the farm labor force is evolving.
Non-H-2A Employment
Non-H-2A agricultural employment in Michigan has been rising since 2000, but this trend could reverse moving forward. In 2023, there were over 34,000 non-H-2A jobs on the books of Michigan agricultural employers in an average month during the year. Agricultural work is seasonal and fluctuates throughout the year. The peak employment months are during the summer when the number of non-H-2A jobs on the books of employers is over 41,000. January is the month with the lowest employment with just under 30,000 non-H-2A jobs.
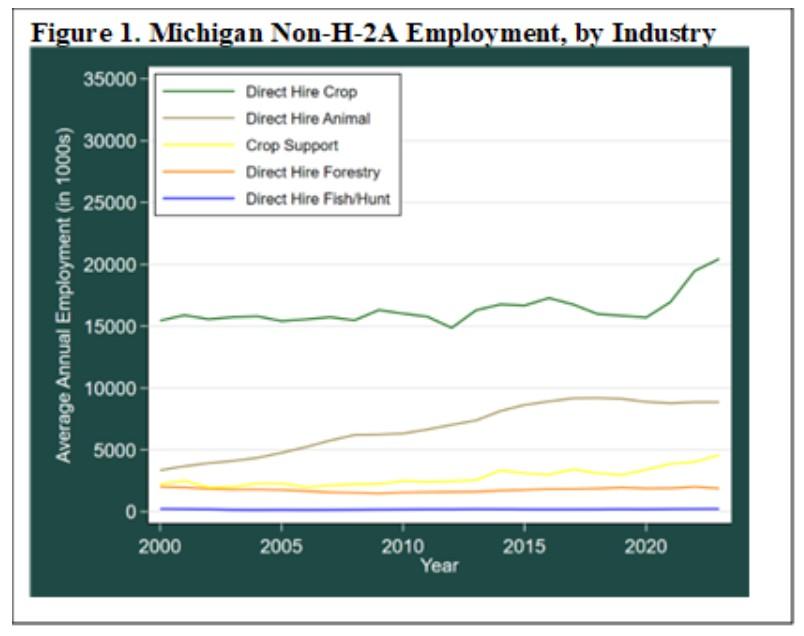
Most of Michigan’s non-H-2A farmworkers are directly hired by crop farmers, with a smaller share in animal agriculture (Figure 1). A rising share of farmworkers, brought to farms by crop support workers, perform tasks such as tilling the soil, pruning, weeding and harvesting through contracts with farmers. The average annual employment of non-H-2A crop workers is approximately 20,000, with around 10,000 involved in animal production and another 5,000 in crop support services.
H-2A Employment
In 1952, the H-2 program was created by the Immigration and Nationality Act, which allowed foreign laborers to enter the country temporarily to perform “low-skilled labor" in both the agricultural and non-agricultural sectors. With the passage of the Immigration Reform and Control Act in 1986, the H-2 program was broken into the H-2A program for agricultural workers and the H-2B program for non-agricultural workers. Currently, there is no cap on the number of H-2A visas that can be issued, but agricultural employers must certify that they are unable to find domestic workers before they are approved to hire H-2A workers. Foreign agricultural workers present in the country under the H-2A visa program must leave the US once their visas expire. Under the current provisions of the program, job vacancies filled by H-2A workers must be considered seasonal in nature, precluding industries with nonseasonal (i.e., year-round) labor shortages from using the program.
H-2A employers must also follow other rules. First, employers must provide housing to H-2A workers and pay for the employees’ transportation to and from their home country. Second, they must pay the highest of the state or federal minimum wage, the prevailing wage rate as determined by a State Workforce Agency, the agreed upon collective bargaining wage rate, or a super minimum wage known as the Adverse Effect Wage Rate (AEWR). The binding wage rate for H-2A workers in Michigan is almost always the AEWR, so the AEWR sets the minimum wage for most H-2A employees. H-2A employment has been rising in recent years throughout the nation and in Michigan. In fiscal year 2023, there were over 15,000 H-2A jobs certified to work in Michigan (Figure 2). Most of these workers are employed in the western part of the state. The leading counties were Kent with 2,500 H-2A jobs certified, Oceana (1,700), Ottawa (1,400), Van Buren (1,300), and Berrien (1,300).
Wages – non-H-2A and H-2A
As the supply of farm labor declines and demand for labor has grown, the wages of farmworkers have increased. According to the National Agricultural Workers Survey (NAWS), which produces wage estimates at the multi-state region level, non-H-2A crop wages in the Lake Region have risen 88% from $7.87 in 2000 to $14.08 in 2022 (see Figure 3). The AEWRs for H-2A workers in the Lake Region have risen 132% from $7.65 in 2000 to $18.15 in 2024.
Demographics
The National Agricultural Workers Survey provides data that allows researchers to track trends in the demographic characteristics of non-H-2A crop farmworkers. Michigan is included in the NAWS Lake Region, which includes Michigan, Minnesota and Wisconsin. As such, the statistics presented in this report may only partially reflect that of Michigan, but it is the only data set that permits regionally representative analyses of U.S. crop farmworkers.
Figure 4 displays the average age of Lake Region crop farmworkers over the past three decades. The average farmworker in the 1990s was much younger, as new immigrant workers replaced those who were aging out of the workforce. However, over the past three decades, the average age of Lake Region crop farmworkers has increased from 30 years in the 1993-1997 period to 39 years in the 2018-2022 period. These statistics reveal that the domestic crop farm workforce is aging as workers who entered the country in the 1990s and early 2000s in their 20s and 30s are now in their 40s and 50s.
Additionally, the share of Lake Region farmworkers who are migrants traveling at least 75 miles to their place of work has declined rapidly over the past three decades. Figure 5 shows that between 1993 and 1997 the share of the workforce who were migrants was 67%, and that number decreased to 27% between 2018 and 2022.
Domestic farm labor supply is declining, causing farm wages to rise
The population of Mexican immigrants residing in the U.S. has started declining for the first time in decades. The domestic farm labor supply is aging and is not being replaced by young immigrant workers the way it once was. Additionally, the share of the workforce that migrates to do farm work in the Lake Region has declined significantly, reducing the geographic reach of local labor markets to attract workers who follow the crop during harvest time. These trends have created a situation where the domestic farm labor supply is declining, causing farm wages to rise. Despite this trend, farm employment in Michigan has increased over the past couple of decades, suggesting that the demand for farm labor is outpacing the decline in the supply, causing wages to rise and attracting some new farm employees. As the domestic farm labor force declines, the use of the H-2A visa program to fill labor shortages has become more common. However, there are many rules that agricultural employers must follow to use the H-2A visa program, including paying for housing costs, transportation, and adhering to the AEWR, which is updated each year.
Industry sources have argued that the AEWRs are higher than local market wages and that there is a disconnect between the survey that determines these wages and local farm labor market conditions. Industry groups argue that domestic farm businesses that rely on the H-2A visa program may soon go out of business. They cannot pass higher labor costs onto consumers because they do not determine what prices they will receive when they sell their crops. Local industry groups say that competition from countries that import specialty crops to the U.S. adds additional pressure, These countries usually have much lower labor costs than those in the U.S., allowing them to offer fresh produce at prices that domestic farmers cannot match. While the H-2A program has expanded in the Lake Region, growth in the program has slowed down over the past few years, which may be evidence that the rising cost of labor throughout the program has reached its tipping point.
As a part of an ongoing effort to provide timely and relevant information to Michigan’s agricultural stakeholders, Michigan State University Extension continues to work with farmers, farmworkers, and industry partners to support Michigan agriculture.
Additional Resources
Adverse Effect Wage Rates
https://flag.dol.gov/wage-data/adverse-effect-wage-rates
https://www.dol.gov/newsroom/releases/eta/eta20230227
Related MSU Extension Articles
https://www.canr.msu.edu/news/farm-workforce-modernization-act-and-h-2a-visa
https://www.canr.msu.edu/news/what-are-adverse-effect-wage-rates
This article was published by Michigan State University Extension. For more information, visit https://extension.msu.edu. To have a digest of information delivered straight to your email inbox, visit https://extension.msu.edu/newsletters. To contact an expert in your area, visit https://extension.msu.edu/experts, or call 888-MSUE4MI (888-678-3464).