But can it be profitable? An initial economic summary of an aspirational cropping system
 Print
Print Email
EmailOpening the financial books on the first two years of the Kellogg Biological Station Long-Term Agroecosystem Research.
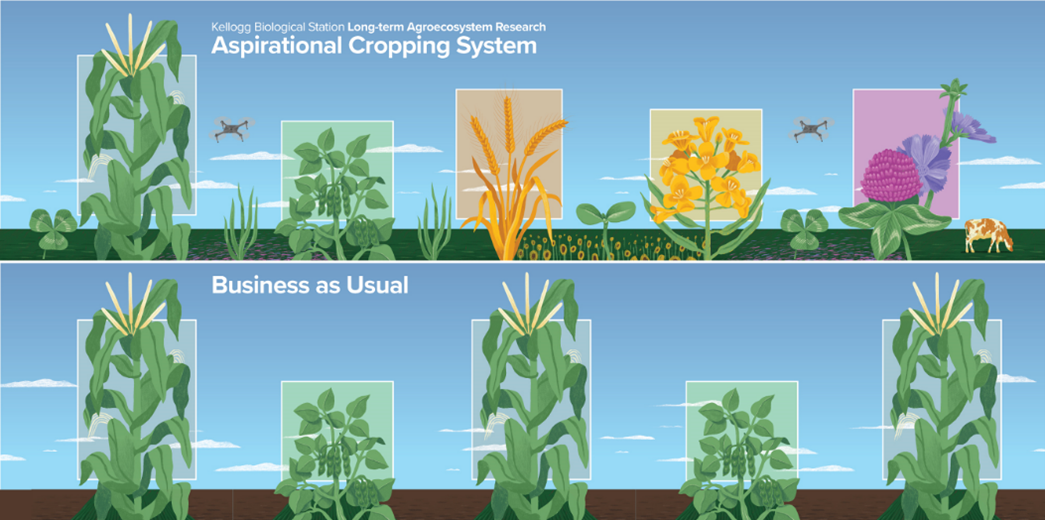
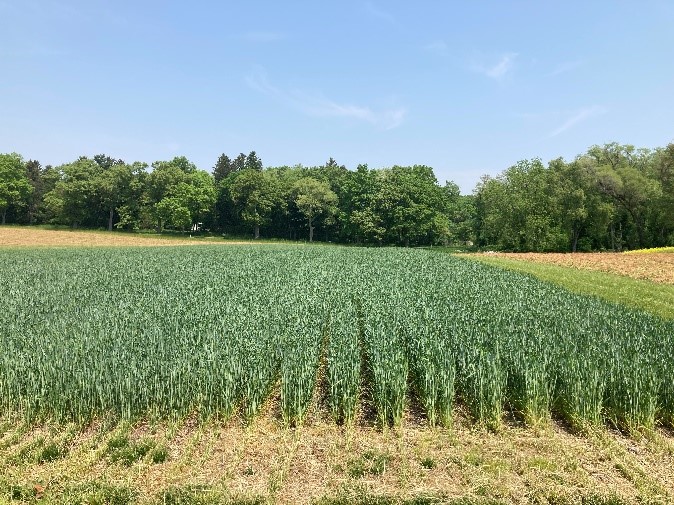
At the Kellogg Biological Station’s (KBS) Long-Term Agroecosystem Research (LTAR) site, current field crop practices, or business-as-usual (BAU) practices, are compared to aspirational (ASP) practices in a system codesigned by scientists and stakeholders (Photo 1). While many production and environmental factors are compared between these systems, a central question being researched is whether a system like the ASP is profitable when compared to conventional management.
The BAU system is based on prevailing practices in Michigan field crops according to producer surveys and United States Department of Agriculture data. This system includes a conventionally tilled and fertilized corn/soybean rotation without cover crops. The ASP system includes a five-crop rotation (corn, soy, wheat, canola and forages), manure application, cover crops, continuous no-till and variable rate fertilizers based on yield stability mapping. Below, we share the initial financial status of the ASP and BAU systems after two years, highlighting both challenges and successes in implementing these management options.
Comparing corn and soy in 2022
Table 1 presents a summary of how corn and soy in the ASP system compared financially to the BAU system in 2022, the first full cropping year of this study. In 2021, all fields were preceded by corn without any cover crops. Key practice differences that affected profitability (Table 1) include:
- In both corn and soy, there were two tillage passes in the BAU system while no tillage passes were made in the ASP system.
- The ASP system included manure as a part of the fertilizer program before corn. Costs of manure include estimated hauling/spreading costs and manure value, proportionally allocated over three years using a 50/30/20% split. Since manure is applied only before corn, it is not included in the 2022 expense for soybeans.
- For corn planting, the ASP system had a lower per acre cost. By using variable rate planting in the ASP system, there was a slightly lower average seeding rate compared to the BAU (an average of 28,000 per acre versus 30,000 per acre).
- In the ASP system, there was an added expense of inter-seeding cover crops when corn was at V6.
- Planting costs were lower in ASP soybeans because seed treatments were not used.
- Handling and drying costs for both corn and soy were slightly different due to yield differences in the BAU and ASP systems.
- Wheat was planted after soy, and there was no cover crop planted or manure applied before soy during the transition year of 2021-2022, so no cover crop or manure costs were incurred in ASP soybean.
- The costs of lime are split over several years. In ASP, one ton per acre of lime is estimated every six years and in BAU, one ton/acre is estimated every three years.
- Soil sampling in the ASP is more expensive than the BAU because ASP fields are grid sampled every three years whereas BAU fields are field/zone sampled every three years.
Overall, the 2022 ASP cost of production for corn was $637 per acre and the BAU cost of production for corn was $773 per acre. For soybeans, the ASP cost of production was $303 per acre and the BAU cost of production was $431 per acre (Table 1).
|
Table 1. A summarized list of per acre production expenses for the aspirational (ASP) and business-as-usual (BAU) systems in 2022 for corn and soybeans. Each line item includes the product's total cost, application cost and labor cost throughout the season. |
||||
|---|---|---|---|---|
|
2022 Field Operation Costs |
Corn |
Soybeans |
||
|
BAU |
ASP |
BAU |
ASP |
|
|
Tillage |
$30.00 |
|
$30.00 |
|
|
Manure |
|
$71.25 |
|
|
|
Fertilizer |
$320.00 |
$168.00 |
$157.00 |
$76.00 |
|
Planting |
$166.00 |
$133.00 |
$70.00 |
$60.00 |
|
Herbicide |
$60.00 |
$66.00 |
$75.00 |
$75.00 |
|
Other Pesticide |
$30.00 |
$29.00 |
|
|
|
Cover Crops |
|
$15.00 |
|
|
|
Harvest |
$65.00 |
$65.00 |
$65.00 |
$65.00 |
|
Handling/Drying |
$86.76 |
$80.04 |
$19.03 |
$17.43 |
|
Soil Sampling |
$2.00 |
$3.15 |
$2.00 |
$3.15 |
|
Lime |
$13.40 |
$6.70 |
$13.40 |
$6.70 |
|
Total |
$772.76 |
$637.14 |
$431.43 |
$303.28 |
Table 2 summarizes how the systems compared in terms of yield and profitability in 2022. Despite the BAU corn’s yielding higher (217 bushels per acre) than the ASP corn (200 bushels per acre), the BAU corn crop was slightly less profitable than ASP ($637 per acre versus $664 per acre). Both systems produced profitable crops in 2022, with reduced costs in ASP resulting in only a $27 per acre net difference in profit. For soybeans, average yield in the ASP system was 70 bushels per acre and average yield in the BAU system was 76 bushels per acre. Despite the BAU soybeans’ yielding higher than the ASP soybeans, ASP soybeans were more profitable ($747 per acre) than BAU ($710 per acre) largely due to lower ASP fertilizer and tillage costs.
|
Table 2. Yields and net profits for corn and soybeans in the aspirational (ASP) and business-as-usual (BAU) systems in 2022. |
||||
|---|---|---|---|---|
|
2022 Transition Year Crop |
Business-as-Usual |
Aspirational |
||
|
2022 Yield |
2022 Net Profit |
2022 Yield |
2022 Profit |
|
|
Corn ($6.50/bu) |
216.9 Bu/A |
$637.09/A |
200.1 Bu/A |
$663.51/A |
|
Soybeans ($15.00/bu) |
76.1 Bu/A |
$710.07/A |
70.0 Bu/A |
$746.72/A |
Comparing systems in 2023
Management choices for corn and soybeans were similar in 2023 compared to 2022. In 2023, herbicide costs were greater in the ASP system for both corn and soybeans. In this system, more tools for weed control were needed to control cover crops and herbicide resistant weeds, whereas tillage in the BAU system addressed these pressures. Overall, the 2023 ASP cost of production for corn was $639 per acre and the BAU cost of production for corn was $779 per acre. In soybeans, the ASP cost of production was $380 per acre and the BAU cost of production was $372 per acre (Table 3).
|
Table 3. A summarized list of per acre production expenses for the aspirational (ASP) and business-as-usual (BAU) systems in 2023. Each line item includes the product's total cost, application cost and labor cost throughout the season. |
||||
|---|---|---|---|---|
|
2023 Field Operation Costs |
Corn |
Soybeans |
||
|
BAU |
ASP |
BAU |
ASP |
|
|
Tillage |
$40.97 |
|
$40.97 |
|
|
Manure |
|
$81.25 |
|
$42.75 |
|
Fertilizer |
$263 |
$113.39 |
$78.10 |
$56.10 |
|
Planting |
$140 |
$133.50 |
$98.51 |
$77.85 |
|
Herbicide |
$49 |
$71.01 |
$57.98 |
$70.37 |
|
Other Pesticide |
$46 |
|
|
|
|
Cover Crops |
|
$20.12 |
|
$35.40 |
|
Harvest |
$84 |
$83.92 |
$61.49 |
$61.49 |
|
Handling/Drying |
$140 |
$125.97 |
$19.93 |
$25.87 |
|
Soil Sampling |
$2 |
$3.15 |
$2.00 |
$3.15 |
|
Lime |
$13 |
$6.70 |
$13.40 |
$6.70 |
|
Total |
$778.79 |
$639.00 |
$372.38 |
$379.68 |
Table 4 shows the overall profitability for each crop in rotation within the ASP and BAU systems. ASP corn ($315 per acre) exceeded the per acre profitability of BAU corn ($280 per acre), which was largely due to a decrease in input costs for the ASP crop. ASP management resulted in less profitable soybeans compared to BAU, with a net profit of $279 per acre (ASP) compared to a net profit of $349 per acre (BAU). Manure, herbicide and cover crops all contributed to higher input costs for ASP soybean management, which combined with lower yields, were less profitable than BAU.
|
Table 4. Yields and net profits for the entire rotation in the aspirational (includes corn, soybean, wheat, forage and canola) and business as usual (includes corn and soybean) sites in 2023. |
||||
|---|---|---|---|---|
|
2023 Crop |
Business-as-Usual |
Aspirational |
||
|
2023 Yield |
2023 Net Profit |
2023 Yield |
2023 Net Profit |
|
|
Corn ($5.91/bu) |
179.1 Bu/A |
$279.69/A |
161.5 Bu/A |
$315.45/A |
|
Soybeans ($13.76/bu) |
52.46 Bu/A |
$349.47/A |
47.9 Bu/A |
$279.42/A |
|
Wheat Grain ($8.45/bu) Wheat Straw ($120/ton) Cover Crop Forage ($150/ton) ASP Wheat Total |
|
|
64.86 Bu/A 1.4 Tons/A 1.6 Tons/A
|
$183.84/A $112.20/A $29.61/A $325.65/A |
|
ASP Canola ($0.31/lb) |
|
|
1,773 lb/A |
$180.25/A |
|
ASP Forage ($200/ton) |
|
|
2.1 Tons/A |
-$54.73/A |
|
Whole System Average |
|
$315/A |
|
$209/A |
Table 4 also reports the profitability of the other three crops in the ASP rotation: wheat, canola and forage. Wheat yields in the ASP rotation were about 65 bushels per acre, which was slightly below average for the area in 2023 (average wheat yields for Barry County in 2023 were 69.3 bushels per acre). However, the added value of the wheat straw and cover crop sold as forage improved the profit margin for the wheat-based crop sequence. Canola, a crop that is rare in the region, did not result in a competitive per acre profit when compared to the other grain crops. Lower than expected yields resulted from slug damage shortly after seeding and very dry conditions during grain fill.
Perennial forage yields were also lower than expected in 2023, largely due to drought conditions in June and September. Forage mixtures that include grasses tend to be less productive during drought conditions compared to monoculture alfalfa. The expense of four mechanical forage harvests also contributed to a net financial loss for the forage crop in 2023. The value of harvested forage for each cutting must be carefully estimated before developing a harvest schedule, ensuring that it’s worth the effort for each harvest.
In this particular ASP system, we hypothesized that grazing would be more profitable than mechanically harvesting forages and subsequently spreading manure due to lower costs of production. However, there are other costs of grazing (e.g., fencing, labor and water) that need to be considered in order to identify how best to integrate livestock into such a diverse cropping system.
Comparing profitability so far
In 2023, when comparing the annual per acre profitability of the ASP and BAU rotations, we found that the ASP system's full rotation profitability was lower than that of the BAU system (Table 4). Maintaining profitability across rotations poses a significant challenge for diversified systems. As management complexity increases and new challenges emerge, balancing various factors and adapting to the situation can be difficult. Overcoming obstacles in implementing new conservation practices or adding crops to rotations may initially decrease overall farm profitability in the early years. This aligns with some trends seen during the initial adoption of conservation practices. The expectation is that the ASP system’s profitability will increase over time, but identifying this tipping point and understanding the associated challenges is a key goal of LTAR research.
In time, we expect that including crops like canola and perennial forages in a more diverse rotation will boost the profitability of subsequent cash crops in future years and that the crops themselves will be more profitable as the system’s challenges stabilize. This is why the long-term nature of this experiment is so important. While we continue to share the current challenges and successes of the system, the long-term nature of this experiment will ultimately provide a holistic and realistic comparison of these management approaches that can’t be observed in shorter timescales.
Financial sustainability is one of the most impactful ways to assess how the ASP system works in practice. Though we haven’t reached the end of a full five-year rotation, we will continue taking the financial “pulse” of the ASP system each year. With each checkup, we’ll continue to evaluate profitability during this transition to innovative, conservation-based crop system management.