Christmas tree irrigation: When and how much should I irrigate?
 Print
Print Email
EmailUsing an evapotranspiration model to determine irrigation scheduling can conserve water and improve tree production
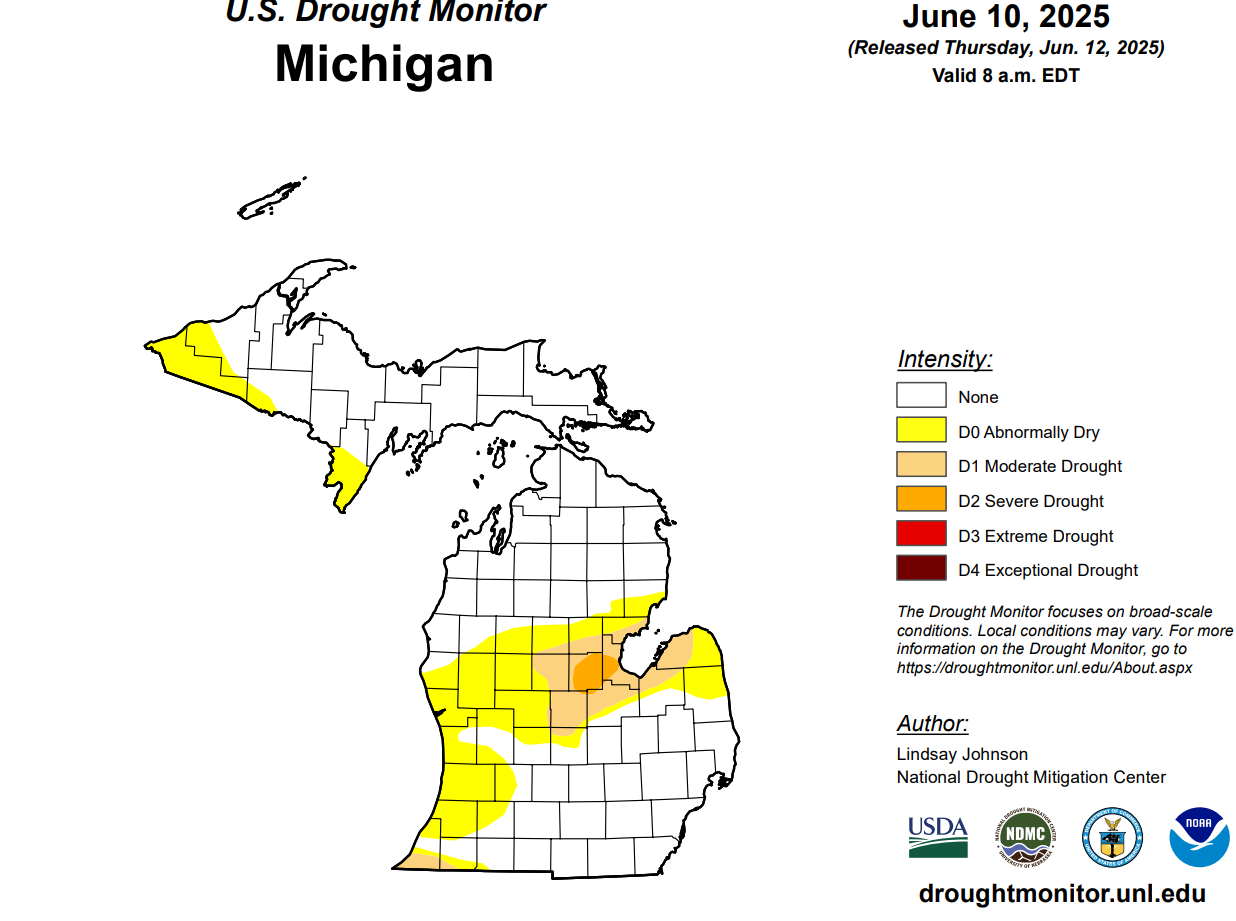
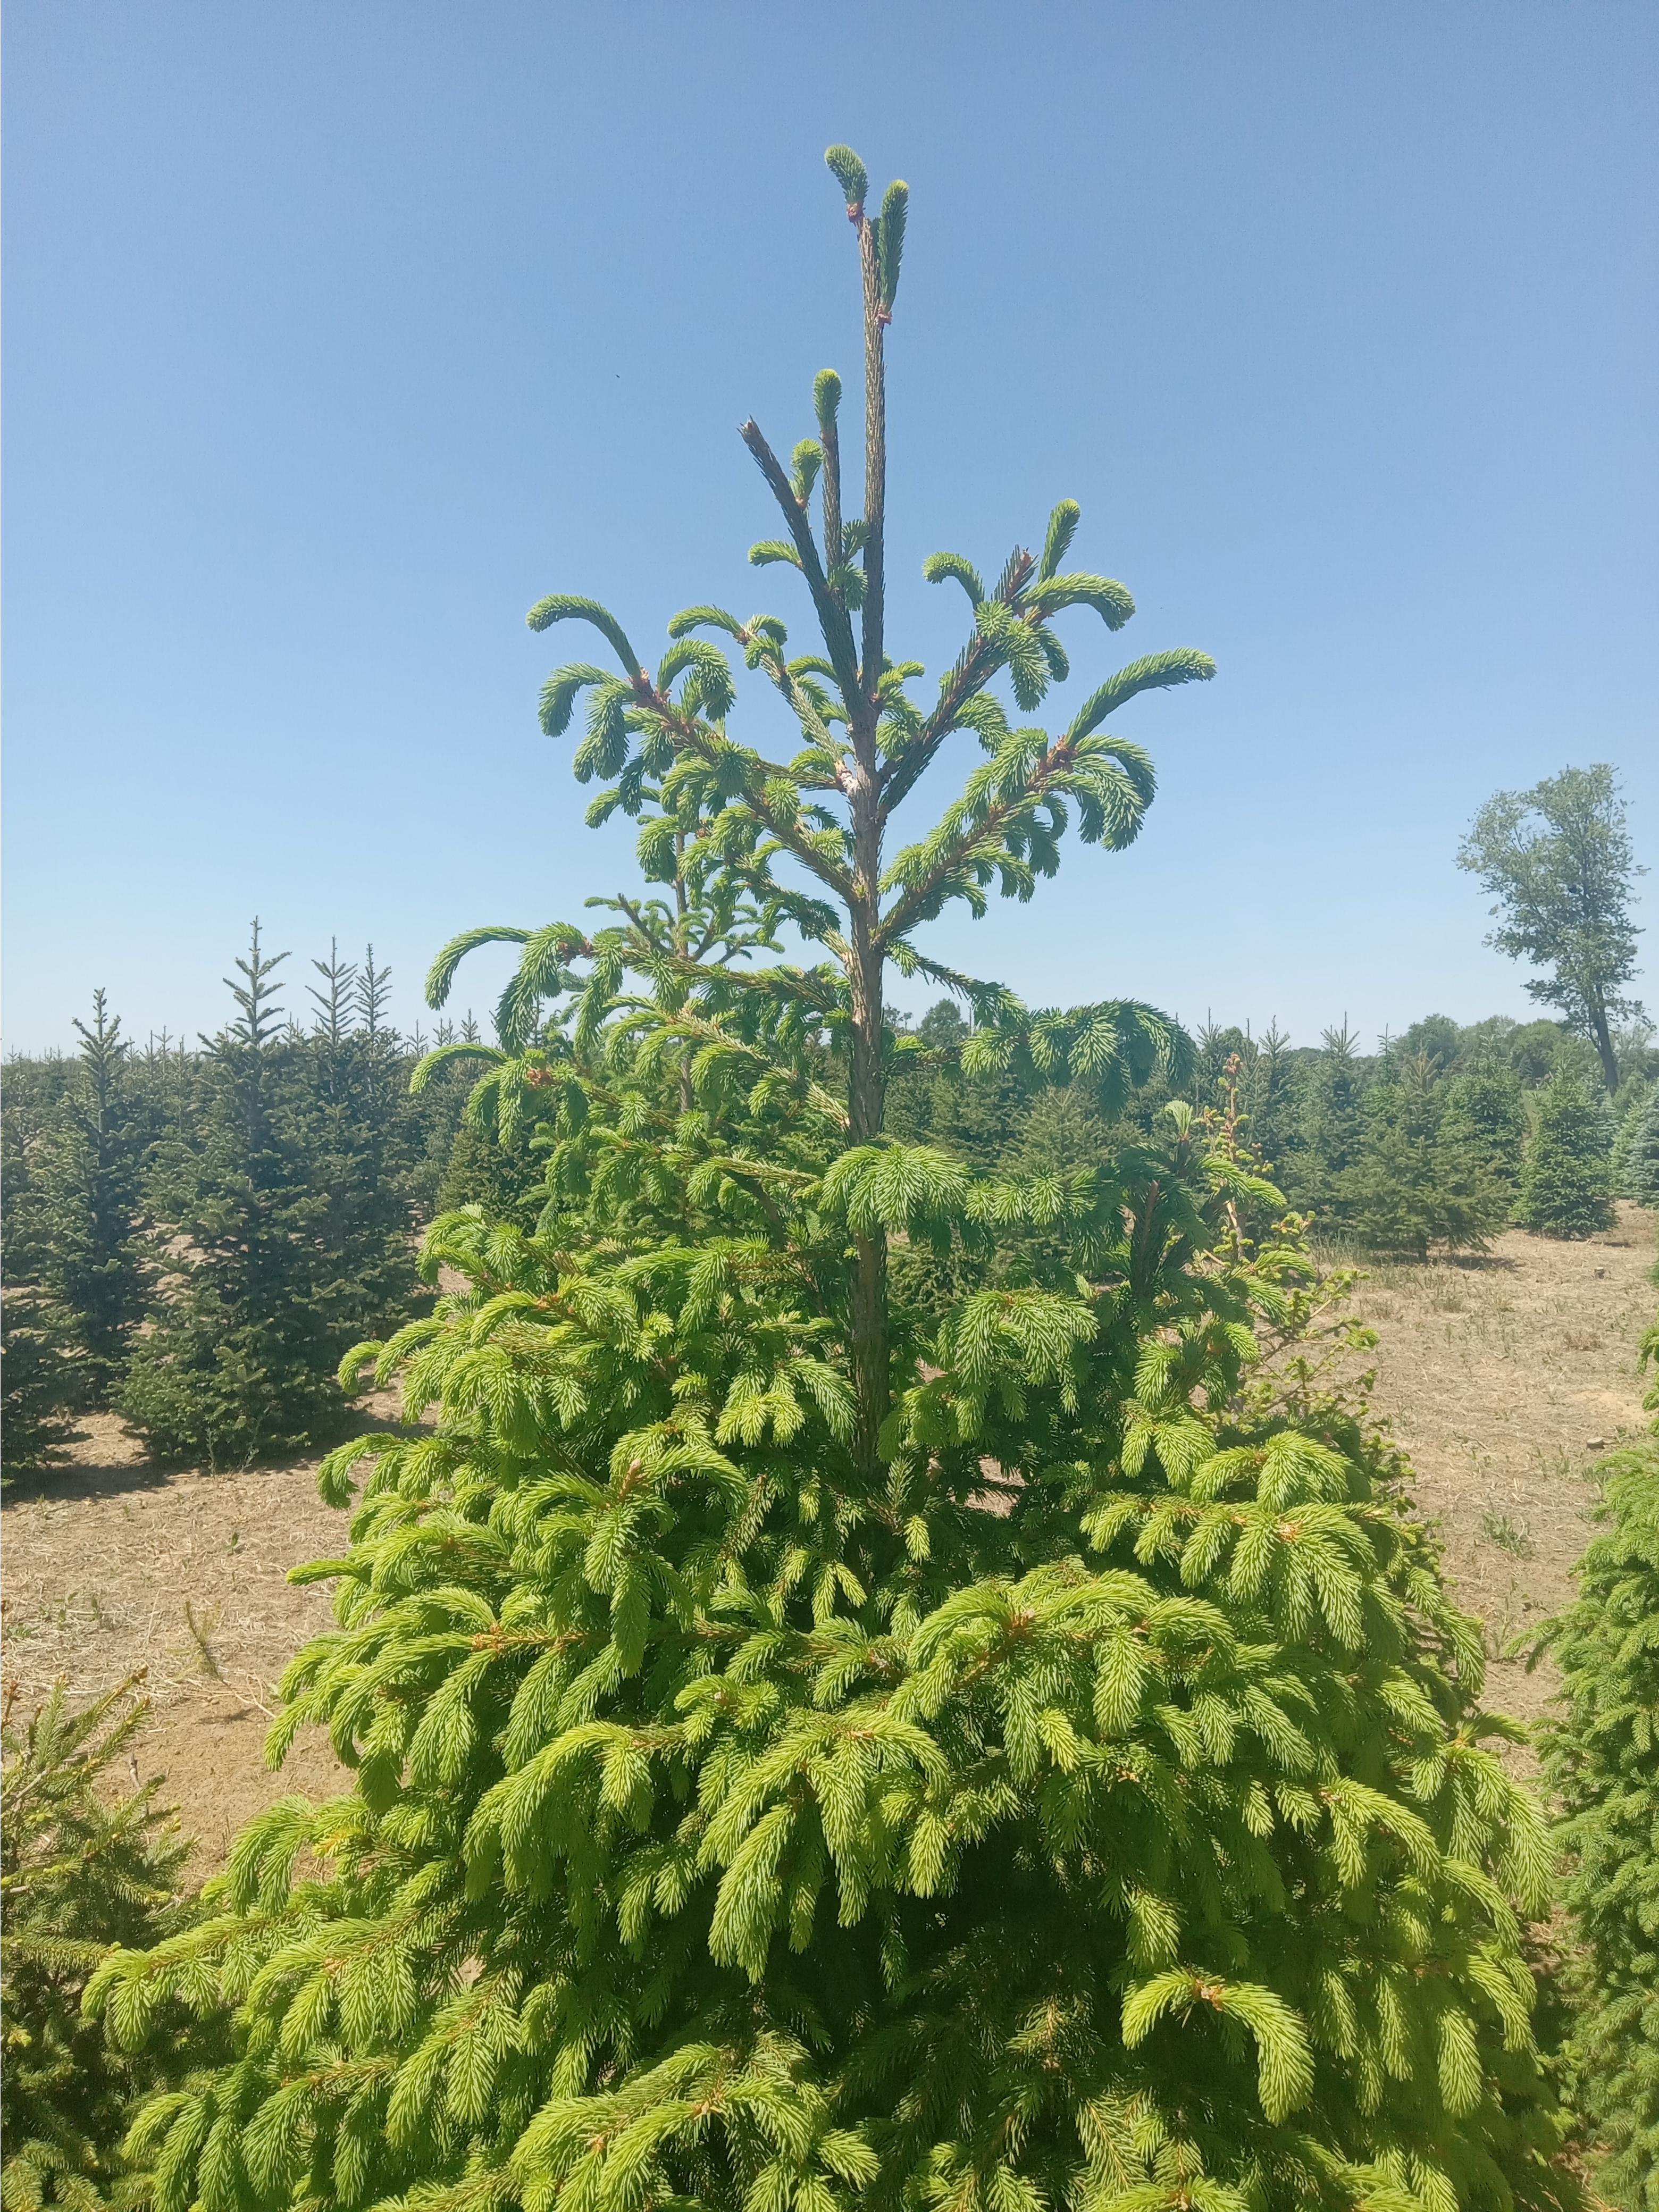
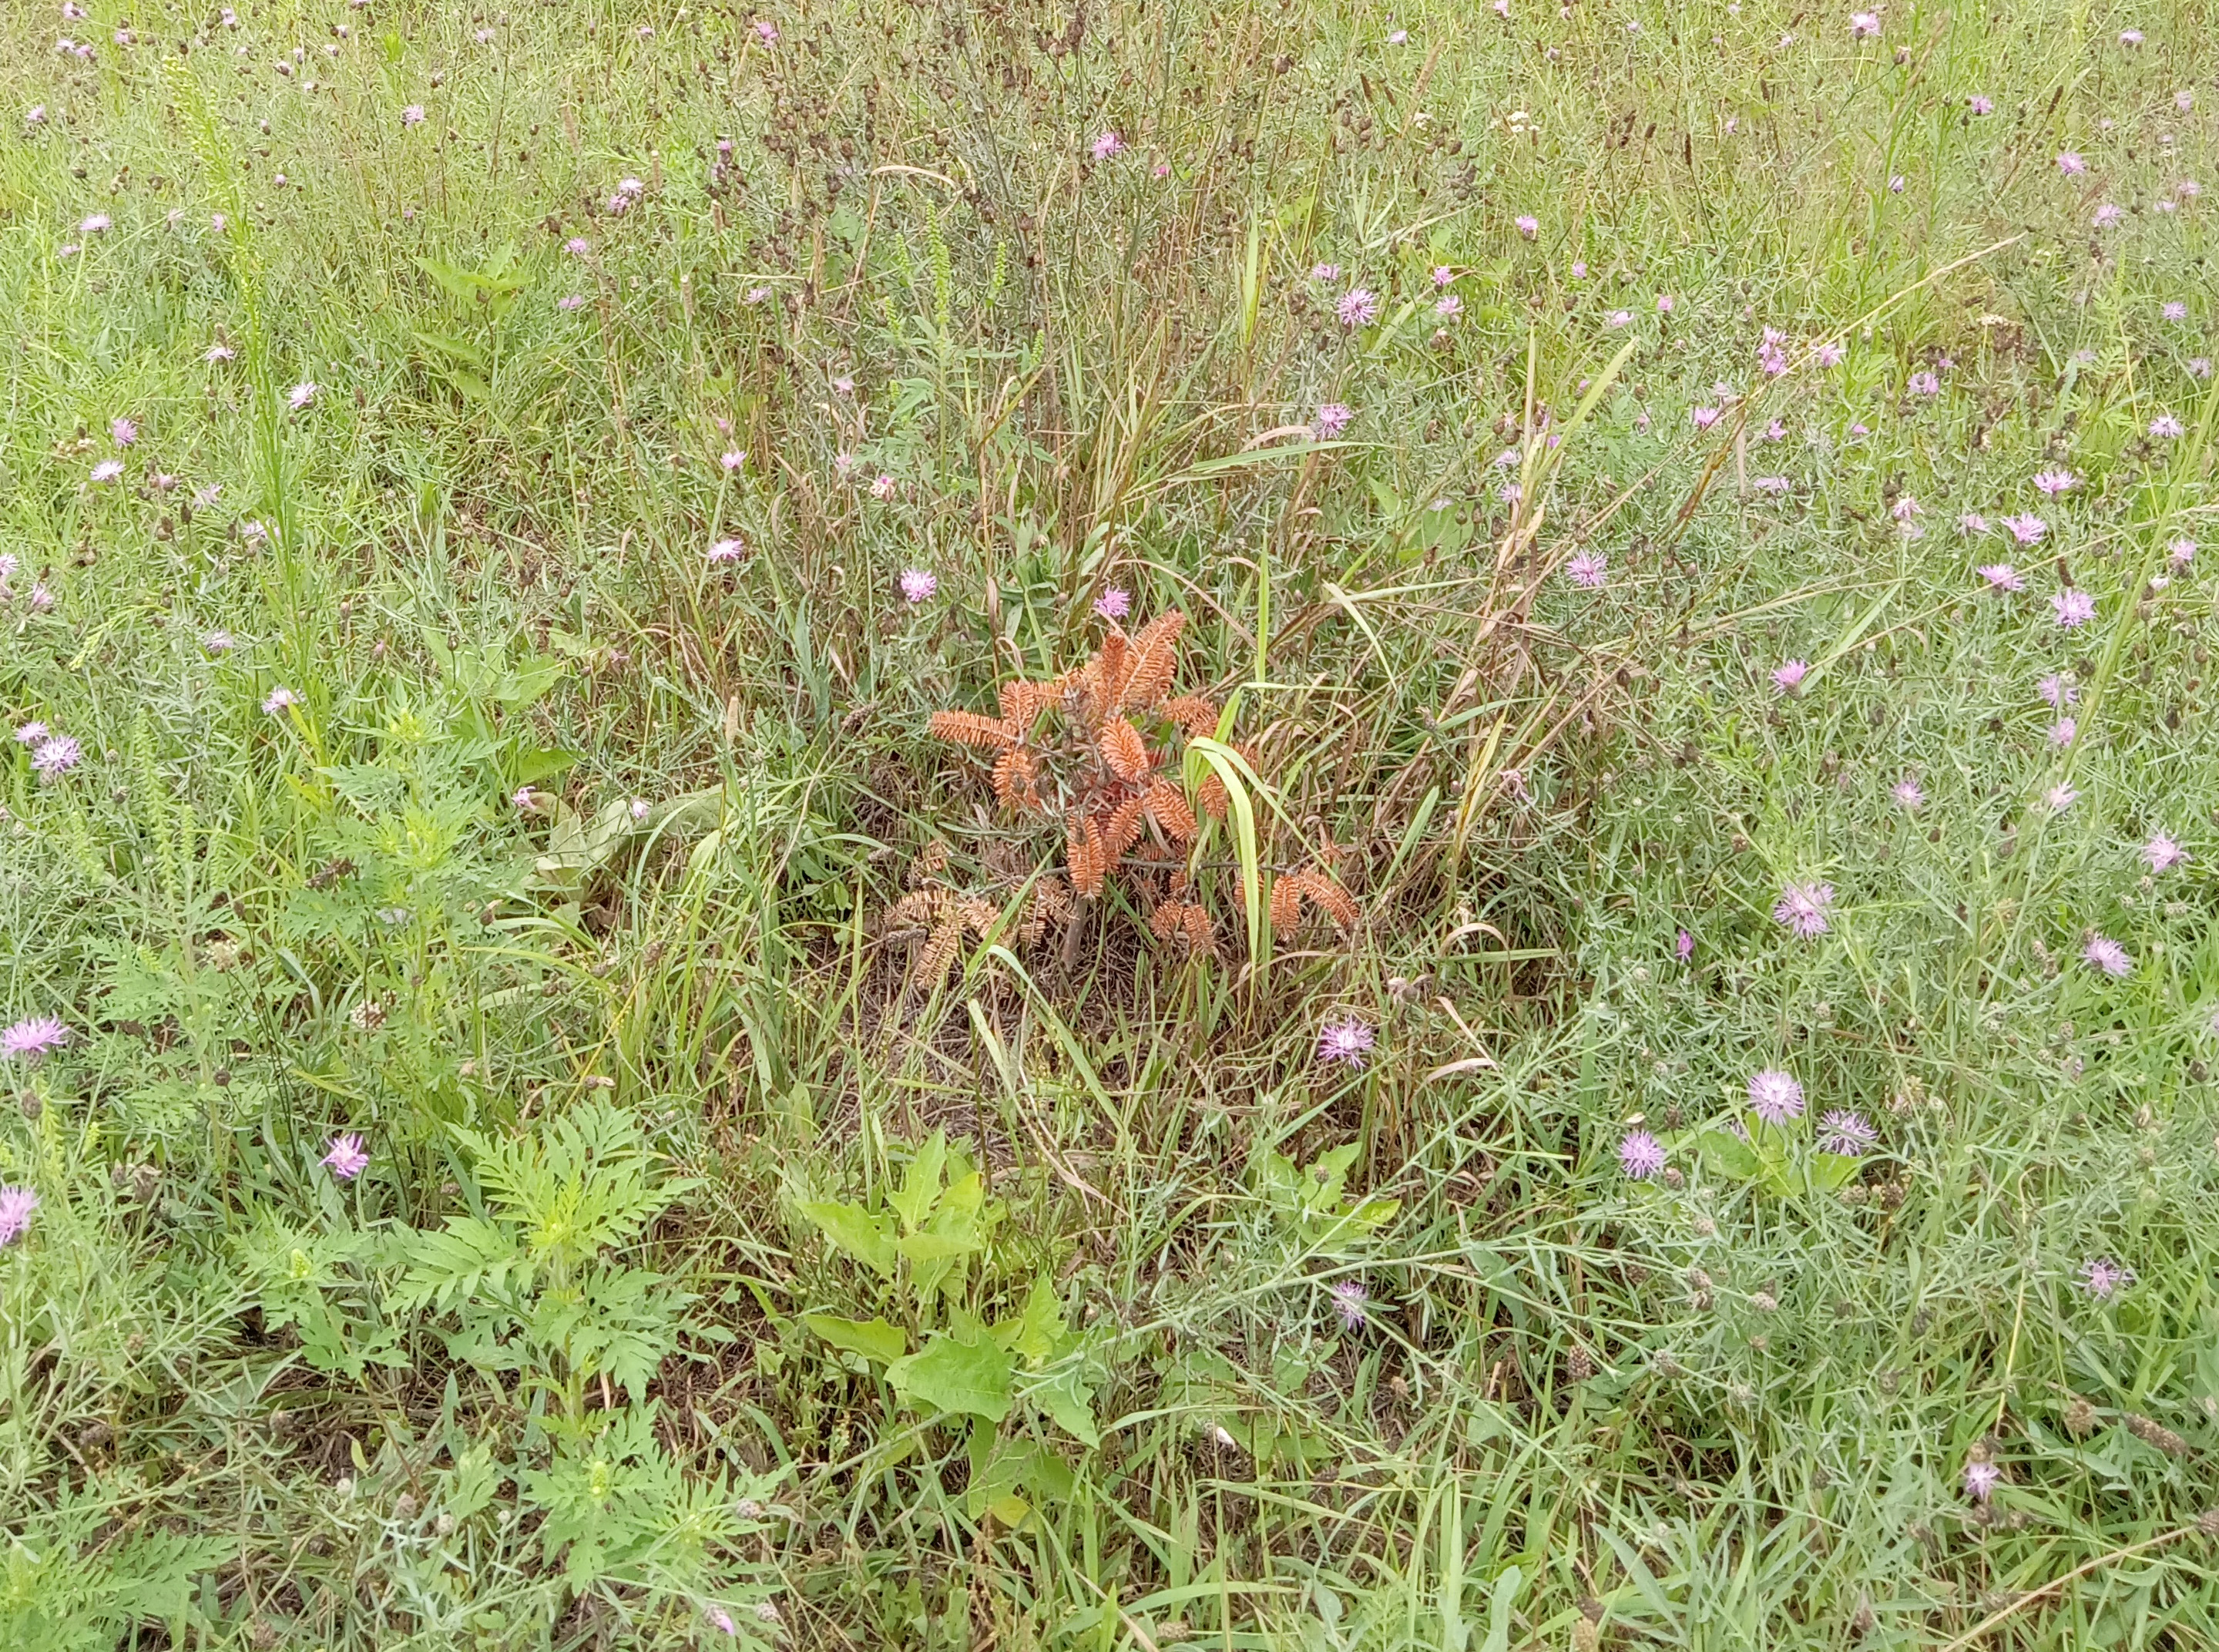
Due to a changing climate, Christmas tree growers have and are expected to experience more extreme weather. One example of this is periods of prolonged droughts. Currently, portions of Michigan are under abnormal to severe drought conditions (Photo 1). When droughts occur, a lack of soil moisture results in trees stress. If the conditions persist, trees may exhibit drooping shoots, indicating a lack of turgor pressure (Photo 2) and/or a reduction in growth. In extreme situations, trees may not survive (Photo 3).
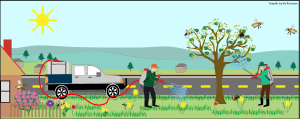
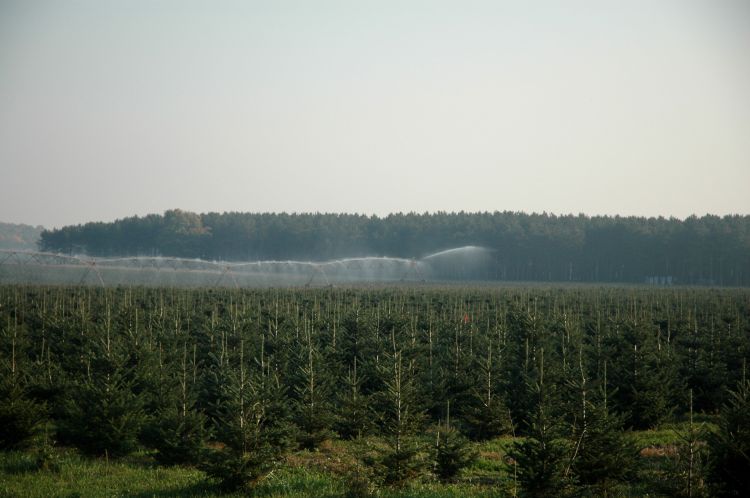
One way to mitigate drought conditions is by adding irrigation to Christmas tree fields (Photo 4). However, determining when and how much to irrigate can be a difficult decision. Excess water applications can lead to disease development, nitrate leaching and a waste of water resources. Under-irrigation can result in trees that experience drought stress and a reduction in tree growth.
In a recent survey, about 40% of Christmas tree growers indicate their irrigation usage is based on a calendar schedule. This style of irrigation may be inadequate as it does not account for environmental conditions, tree growth stages or a field’s water holding capacity. Determining irrigation needs may be better determined by using an irrigation model (for example, an evapotranspiration model). Michigan State University Extension recommends using this model for future irrigation scheduling.
What is an evapotranspiration model?
Evapotranspiration refers to the total amount of water lost from the soil profile based on the combined effects of evaporation of water from the soil surface and transpiration from the canopy of the tree crop. As one would expect, surface evaporation and transpiration by trees are dependent on multiple factors including air temperature, relative humidity, solar radiation and wind speed. Another major factor is the nature of the ground cover or crop.
Meteorologists calculate a reference potential evapotranspiration (PETref) based on weather variables (temperature, relative humidity, radiation, wind), assuming a standard plant canopy (grass, approximately 5 inches high). Reference potential evapotranspiration is included in the weather data available through the Michigan State University Enviroweather system (Table 1). Past and future daily water evapotranspiration values are accessible after your local weather location is selected (for example, 0.15 inch water per day).
Table 1. Daily weather information, including evapotranspiration from East Lansing Enviroweather station. Source: MSU Enviroweather.
| Day | Date | Max Temp (F) | Min Temp (F) | Ave Temp | Rainfall (in.) Today | Rainfall (in.) Since 3/1 | Reference Potential Evapotranspiration (in.) Daily Total |
|---|---|---|---|---|---|---|---|
| Sun | 6/1/25 | 67.7 | 38.9 | 53.3 | 0 | 10.4 | 0.19 |
| Mon | 6/2/25 | 77.1 | 40.1 | 58.6 | 0 | 10.4 | 0.21 |
| Tue | 6/3/25 | 85.9 | 53.5 | 69.7 | 0 | 10.4 | 0.22 |
| Wed | 6/4/25 | 77.6 | 61.3 | 69.4 | 0.5 | 10.9 | 0.09 |
| Thu | 6/5/25 | 72.7 | 55.6 | 64.1 | 0.6 | 11.4 | 0.14 |
| Fri | 6/6/25 | 76.4 | 54.1 | 65.2 | 0 | 11.4 | 0.2 |
| Sat | 6/7/25 | 76.7 | 50.3 | 63.5 | 0 | 11.4 | 0.21 |
| Sun | 6/8/25 | 77.6 | 56.6 | 67.1 | 0 | 11.4 | 0.17 |
| Mon | 6/9/25 | 76.4 | 54.5 | 65.4 | 0.1 | 11.5 | 0.17 |
| Tue | 6/10/25 | 69.9 | 51.7 | 60.8 | 0 | 11.5 | 0.14 |
| Wed | 6/11/25 | 83.6 | 49.1 | 66.4 | 0 | 11.5 | 0.23 |
How much water can the field hold?
The other critical aspect to determine is the water holding capacity of your field. You can find this information from Table 2, or a more detailed information can be found on web soil survey.
Table 2. Available water capacity by soil texture. Adapted from “Soil and Water Relationships” by Jeff Ball.
|
Texture Class |
Available water capacity(inches water per foot of depth) |
|---|---|
|
Coarse sand |
0.25 - 0.75 |
|
Loamy sand |
1.10 - 1.20 |
|
Sandy loam |
1.25 - 1.40 |
|
Silt loam |
2.00 - 2.50 |
|
Clay |
1.20 - 1.50 |
How can I use this information to determine irrigation scheduling?
Once your soil texture class and available field water capacity is determined, monitor when approximately half of the available water has been used through evapotranspiration. At that time, turn on the irrigation and recharge the soil back to its full water holding capacity.
Example: For a loamy sand soil, the water holding capacity is approximately 1.20 inches of water per foot. For Christmas trees, we estimate that the majority of tree roots are within the top 2 feet of soil. The total water available in that area would be about 2.4 inches of water. Irrigation should be applied once the field capacity is 50% depleted. This would occur when daily evapotranspiration accumulation has totaled about 1.2 inches. A hypothetical evapotranspiration model indicated that 0.25 inches of water per day has been used. With no additional rainfall, you would need to irrigate after about five days with a goal of applying about 1.2 inches of water per acre. A soil water balance sheet is also available to help you document this process.
One factor to note is that the reference PET provided by Michigan State University Enviroweather is based on a standard grass canopy. Therefore, PETref will likely overestimate total water use for new Christmas tree plantings with relatively low canopy leaf area, and underestimate water use for larger trees nearing harvest.
Nonetheless, using PET to guide irrigation decisions is an important step in matching water supply to crop demand. Developing crop coefficients, which adjust PETref based on Christmas tree crop development, is the goal of ongoing research by Younsuk Dong, PhD, of the Department of Biosystems and Agricultural Engineering at Michigan State University and his research team.