Cow-calf benchmarking, where does Michigan rank?
 Print
Print Email
EmailBenchmarking is an important tool farmers can use to compare their operation’s financial and production information to averages in the industry.
The Michigan State University TelFarm program was, for decades, the cornerstone accounting and farm financial analysis system for the state of Michigan. Starting in 1928, it evolved into a mail-in computer records program in the mid-1950s. Over the next 40 years, it changed into a software accounting system with local personal support from MSU Extension staff who help with tax planning, year-end financial analysis, and a benchmarking system that feeds the information into FINBIN. FINBIN is a finance and production benchmarking information source through the Center for Farm Financial Management at the University of Minnesota.
Through FINBIN, producers can access reports on a huge list of various enterprises to compare their farms. If enough records and data exist, producers can see how they stack up against the average of producers in their state and sometimes the region of their state. Unfortunately, Michigan cattle producers cannot compare their operations to the average of the state because there are not enough Michigan farms in the system. There used to be, but the number of TelFarm clients has decreased to the point that there are not enough farms in the benchmarking system.
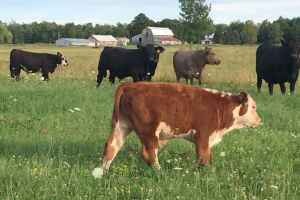
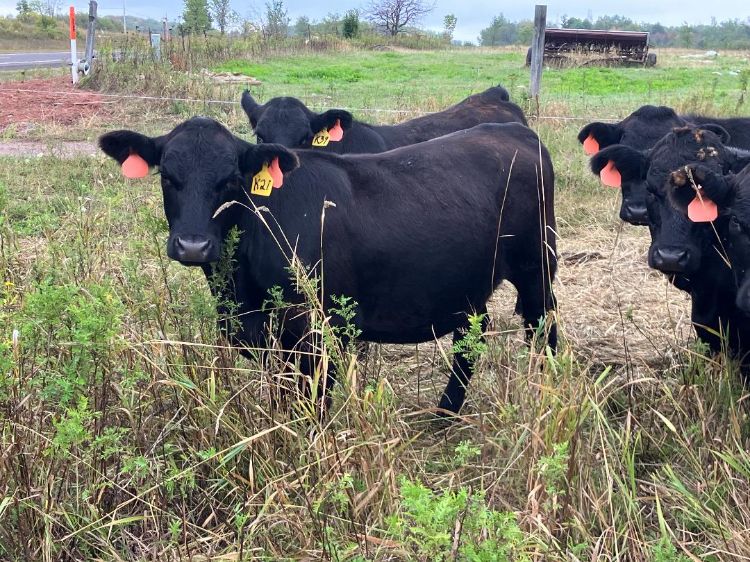
Michigan cattle producers can compare their data to other farms, but it is going to be in a larger geographic region, such as the Midwest or the corn belt. CattleFax conducts an annual nationwide survey of cow-calf producers from across the country. This survey receives responses from producers representing 350,000 cows across 41 states. Their data indicates that the average herd size increased to 385 cows. USDA Census of Agriculture data from 2022 indicates the average beef cow herd size in the U.S. is 47. This indicates CattleFax information may be skewed towards the larger cattle herds.
Some points of interest from the CattleFax survey are summarized in Table 1. Average cow costs were higher for herd sizes of 500-999 and 1,000+ head as compared to those of 0-199 and 200-499. Looking at cash cow costs, pasture costs accounted for 26-28% of the total cost for all four herd sizes. The greatest differences came in the categories of feed and hired labor. Larger herds spent a lower percentage of their total cash costs on feed and hay while spending a higher percentage on hired labor. Producers with smaller herds may be more cost-efficient with hired labor because they provide more unpaid labor through themselves and family.
Table 1. From 2024 CattleFax Cow-Calf Survey
Number of Cows |
0-199 |
200-499 |
500-999 |
1,000+ |
|
2024 Cash Cow Cost, $ |
$728 |
$774 |
$812 |
$806 |
|
Pasture, % |
26% |
27% |
28% |
27% |
|
Feed and Hay, % |
38% |
32% |
26% |
24% |
|
Hired Labor, % |
8% |
13% |
18% |
20% |
|
Vet and Breeding, % |
7% |
8% |
8% |
8% |
|
Overheads, % |
12% |
13% |
13% |
13% |
|
Supplies and Misc, % |
9% |
7% |
7% |
7% |
Looking at production by region, the survey breaks the regional groups into five regions: southern plains, northern plains, southwest, west and corn belt. The corn belt region has the smallest average herd size at 112 cows, 273 less than the national average reported in the survey. The corn belt cow cost was very similar to the other regions; however, the percentage of total cost paid for pasture was eight percentage points lower than the national average, and the percentage paid for feed and hay was 10 percentage points higher than the national average.
The CattleFax Survey is a high-quality dataset that many producers look forward to and use each year for benchmarking. However, survey data is generated by asking questions of cattle producers regarding their feed usage, calf weights, sales prices, and expenses, without any checks and balances. Answers for how much feed was fed may be based on figures taken from feed sheets or from calculations based on how much a cow should eat. Reported expenses may be based on their taxes and contain a mix of prepaid expenses.
Benchmarking data in FINBIN is collected by MSU Extension field staff working with farmers to conduct year-end financial analysis. Prepaid expenses are accounted for by the beginning and year-end balance sheets. The information is accurate and validated. The process is not as simple as filling out a survey. The first year going through this process usually requires a few hours, while subsequent years become easier and faster. In the end, producers have balance sheets, income statements and production records to compare to industry standards.
If you would like to participate in farm financial analysis and benchmarking, please contact an expert in your area, visit https://extension.msu.edu/experts, or call 888-MSUE4MI (888-678-3464).