


Lamb prices start off strong in 2026
 Print
Print Email
EmailIn April 2026, national negotiated live slaughter lamb prices averaged $262.40/cwt., up 53% from the same period in 2025.
Consumers are currently extremely enthusiastic about protein, and lamb is no exception. Beef prices are at record highs, coupled with constrained consumer budgets stemming from the increasing cost of energy. These factors have meat-eaters considering alternative products to maintain desired levels of protein in their diets. Though a less prominent protein than beef, chicken and pork, U.S. lamb and mutton production totaled 139.1 million pounds in 2025, up 0.3% from the year prior. Texas, California and Colorado are home to the largest number of sheep and lambs in the country, whereas Michigan’s 85,000 head represent about 2% of the nation’s total inventory.
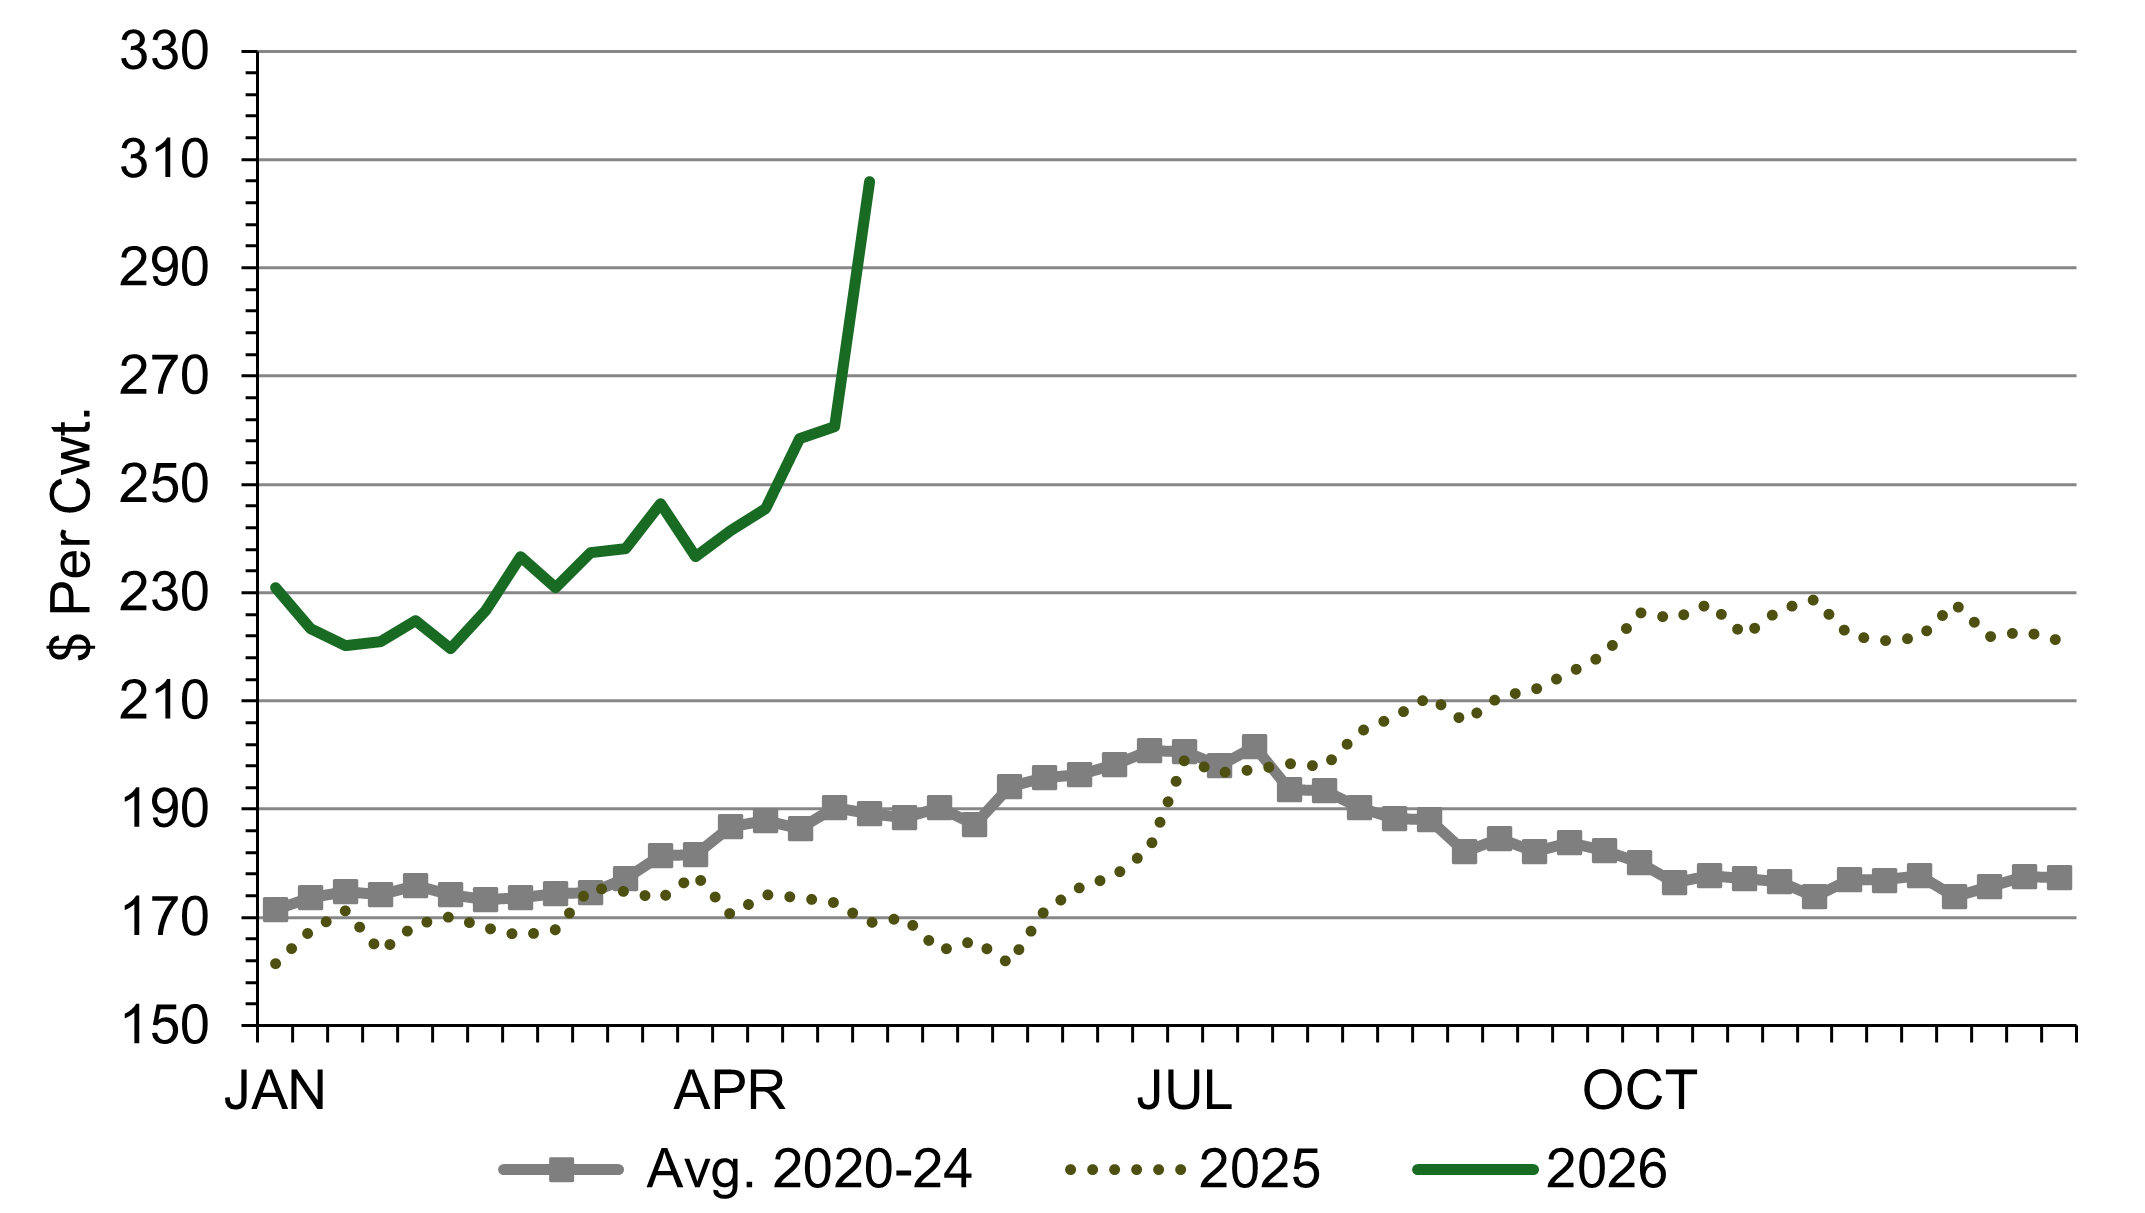
Lamb prices rose above average levels in the latter half of 2025 and started 2026 higher yet. Figure 1 graphs national negotiated live weekly slaughter lamb prices. In April 2026, prices averaged $262.40/cwt., up 53% from the same period in the previous year and 43% above the average in 2020 through 2024. Averages from the first half of the decade show lamb prices typically peak in the summer months, suggesting current prices in 2026 may not yet be at their highest.
Figure 1. National Negotiated Live Weekly Slaughter Lamb Prices
While U.S. production supplied roughly 29% of domestic lamb consumption in 2025, the remainder was made available through imports. Total lamb imports were up 4% in 2025. Australia and New Zealand are consistently our top lamb import partners. The U.S. also exports approximately 4% of domestic lamb production, and U.S. lamb exports were up 38% year-over-year in 2025. The balance of production and trade flows indicates 2.5% more lamb available for U.S. consumers in 2025 versus 2024.
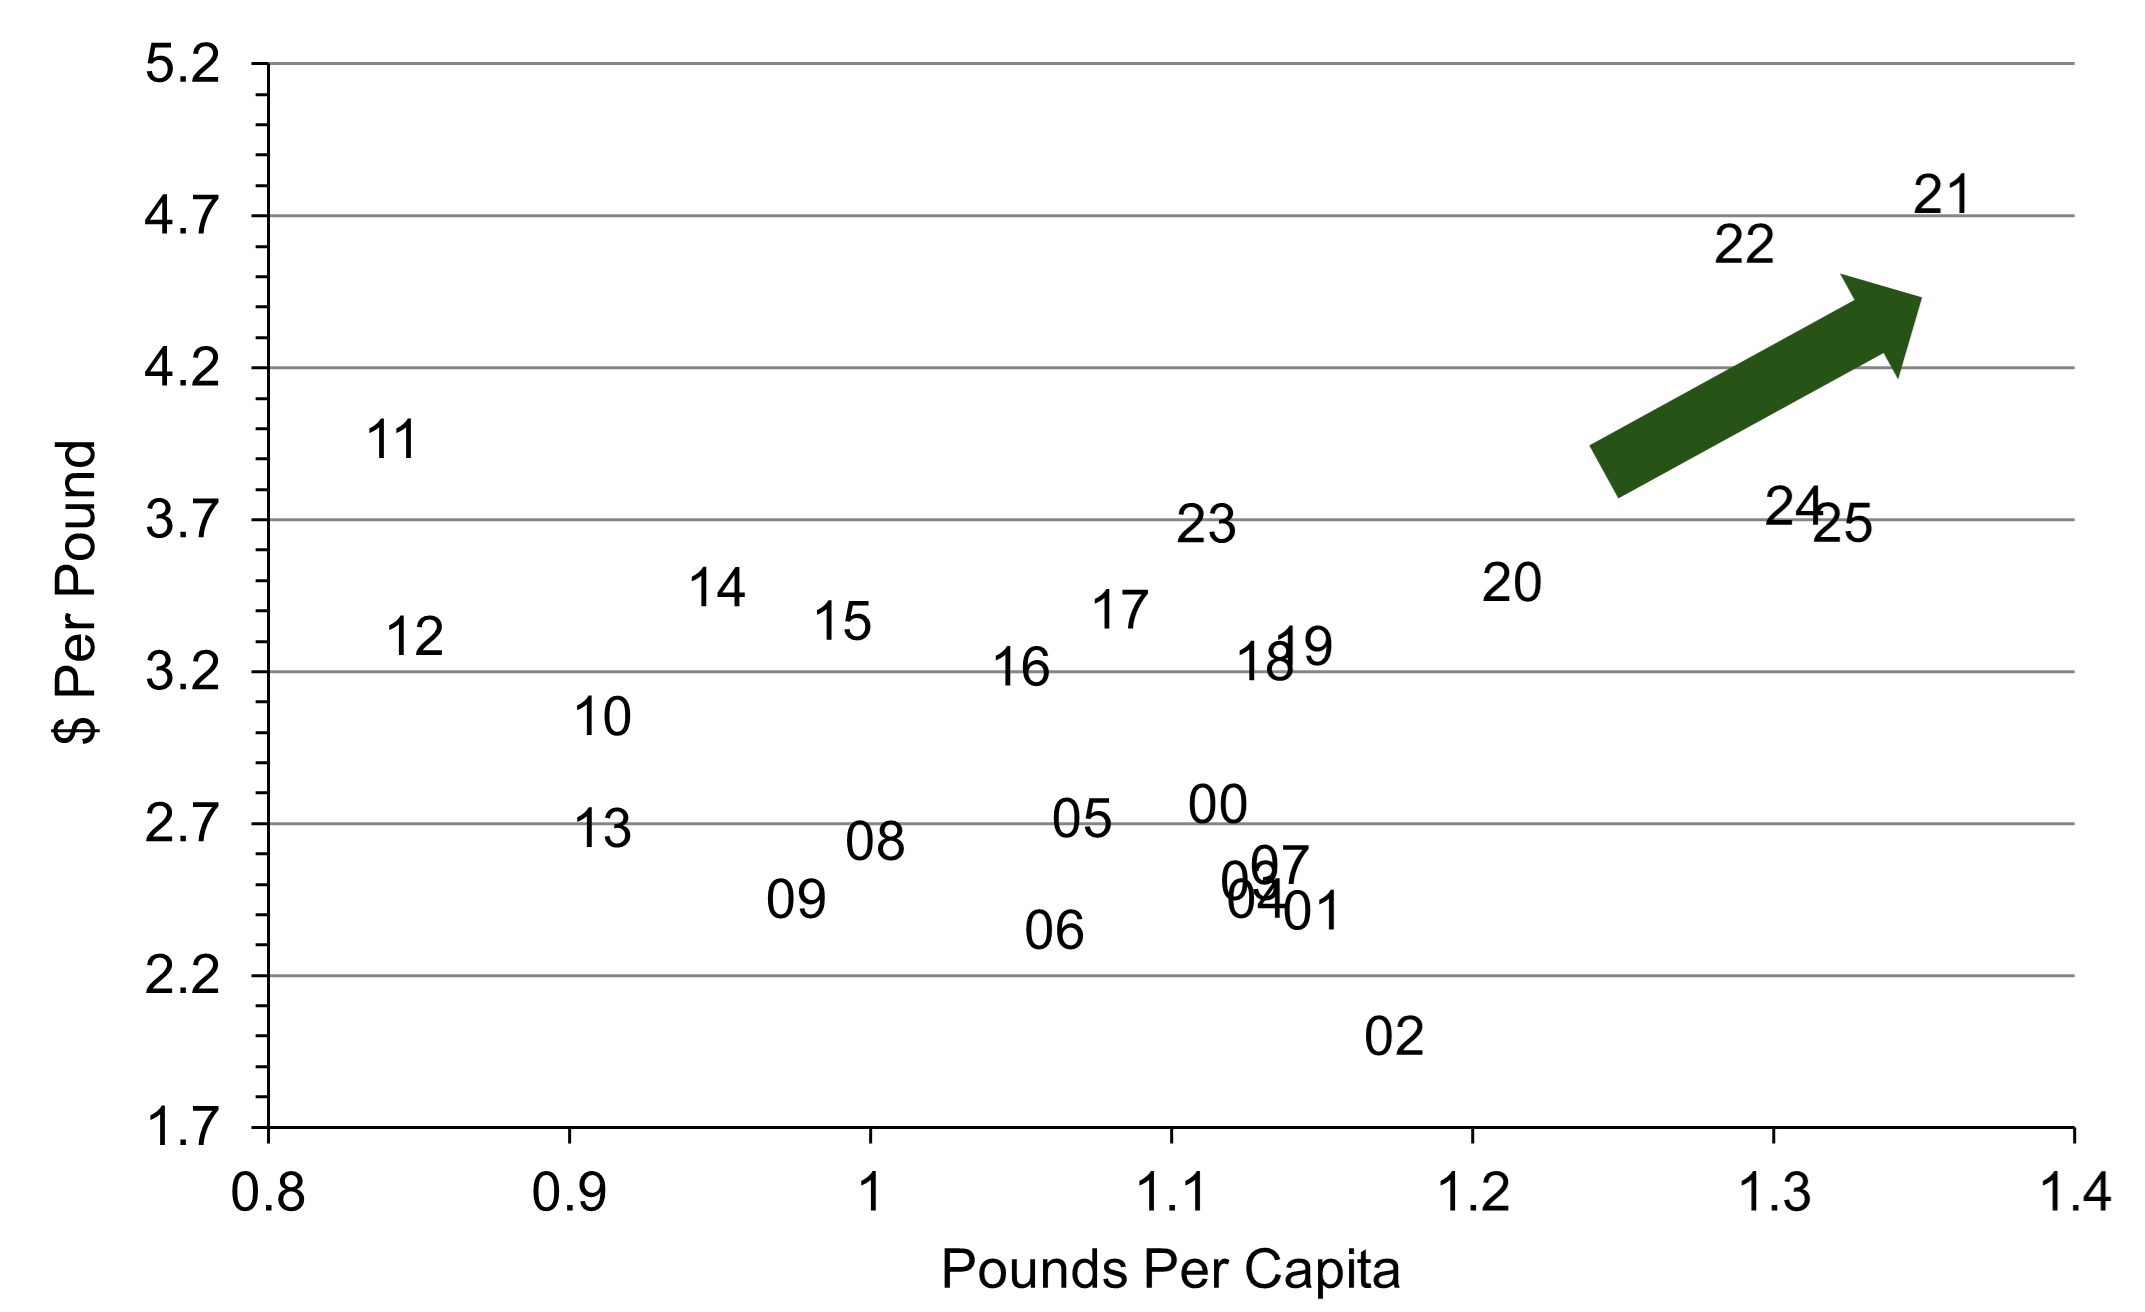
If the supply of lamb in the country is increasing alongside lamb prices, this likely indicates an increase in consumer demand for the product. To measure demand, both price and quantity of consumption must be considered. Figure 2 illustrates price/quantity relationships by year since 2000. As indicated by its position in the graph’s top righthand corner, 2021 represents the best domestic demand year from 2000 through 2025. Importantly, the years comprising the current decade represent an era of strong demand, with consumers increasing per capita consumption while simultaneously paying relatively more for the product than in the past. Lamb demand in 2025 ranks fourth this century, behind 2021, 2022 and narrowly 2024.
Figure 2. Lamb Price-Quantity Relationship by Year (Retail Weight, Deflated Prices)
Increasing strength on the demand front can be the result of substitution due to the relative prices of other proteins, changes in consumer tastes and preferences, and increasing incomes, among other factors. Regardless, strong demand is positive for producers who rely on consumers to provide revenue that ultimately flows through the supply chain back to their operations. The outlook for lamb prices remains robust as we progress in 2026. While changes in trade and supply-side dynamics are likewise influential in lamb markets, the current market landscape suggests a strong year ahead for U.S. sheep and lamb producers.