


Looking beyond appearance: Measuring cover crop biomass in Michigan
 Print
Print Email
EmailLessons learned from a cover crop workshop demonstration field day.
Cover crops are widely valued for their ability to protect soil, improve water infiltration, recycle nutrients, suppress weeds, and build soil organic matter. But when it comes to choosing the right species, one practical question often arises: Which cover crop produces the most biomass?
This answer depends on weather, growing conditions, management practices and, most importantly, the goals of the grower.
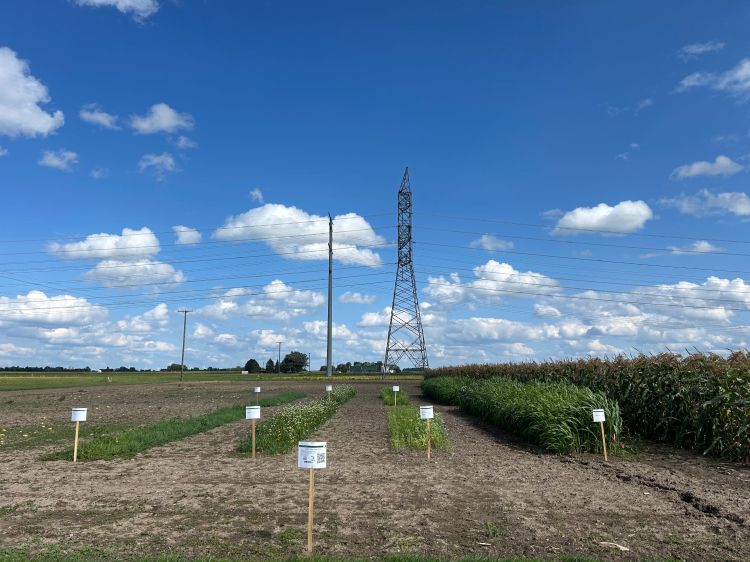
To explore this question, Michigan State University Extension and the Tuscola Conservation District established a cover crop demonstration at the Saginaw Valley Research and Extension Center (SVREC) in Frankenmuth, Michigan (Table 1). The educators and conservation district specialist established cover crop demonstration plots and measured biomass production, ground cover and investigated soil heath indicators across the number of different cover crop species.
Table 1. List of cover crop treatments/species. The plots were 5 x 40 feet and planted on July 23, 2025. Note: Treatment (Trt) 1x = using the prescribed seeding rate; 2x = double seeding rate. The rates were calculated using the Midwest Cover Crop Selector Tool.
|
Trt |
Species |
Rate (lbs./A) |
|---|---|---|
|
1 |
Cereal Rye (CR) 1X |
76.8 |
|
2 |
Buckwheat (BW) 1X |
40 |
|
2 |
Crimson Clover (CC) 1X |
24 |
|
2 |
White Oats (WO) 1X |
48 |
|
3 |
Buckwheat (BW) 1X |
16 |
|
3 |
Crimson Clover (CC) 1X |
16 |
|
3 |
White Oats (WO) 1X |
24 |
|
3 |
Sunn Hemp (SH) 1X |
24 |
|
3 |
Winter Pea (WP) 1X |
24 |
|
4 |
Sorghum Sudan grass (SG) 1X |
80 |
|
Trt |
Species |
Rate (lbs./A) |
|---|---|---|
|
5 |
Cereal Rye (CR) 2X |
153.6 |
|
6 |
Buckwheat (BW) 2X |
80 |
|
6 |
Crimson Clover (CC) 2X |
48 |
|
6 |
White Oats (WO) 2X |
96 |
|
7 |
Buckwheat (BW) 2X |
32 |
|
7 |
Crimson Clover (CC) 2X |
32 |
|
7 |
White Oats (WO) 2X |
48 |
|
7 |
Sunn Hemp (SH) 2X |
48 |
|
7 |
Winter Pea (WP) 2X |
48 |
|
8 |
Sorghum Sudan grass (SG) 2X |
160 |
The results reinforce an important lesson for growers: appearance alone does not tell the whole story. Some cover crops appeared lush and vigorous, producing less biomass than perceived, while other species had higher biomass weights compared to what appeared in the field. Our demonstration highlighted why weighing the cover crops’ biomass can offer better insight of the cover crops’ return.
Why biomass matters
Biomass is often used as an indicator of cover crop performance because it directly influences several soil health benefits. Greater biomass production typically offers better protection soil from erosion, improves water infiltration, increases organic matter inputs, recycles nutrients, and suppresses weeds.
However, more biomass is not always better. The most suitable cover crop depends on a producer's goals and ability to manage the cover crop after termination. Some farmers prioritize soil coverage and erosion control, while others seek nitrogen fixation, forage production, nutrient scavenging, or improved soil structure. Understanding how different species perform under local conditions can help growers select which cover crop/s best fits their management goals and objectives.
When our eyes fool us
One of the most interesting observations made by the farmers was how difficult it can be to estimate biomass visually when it is in the field.
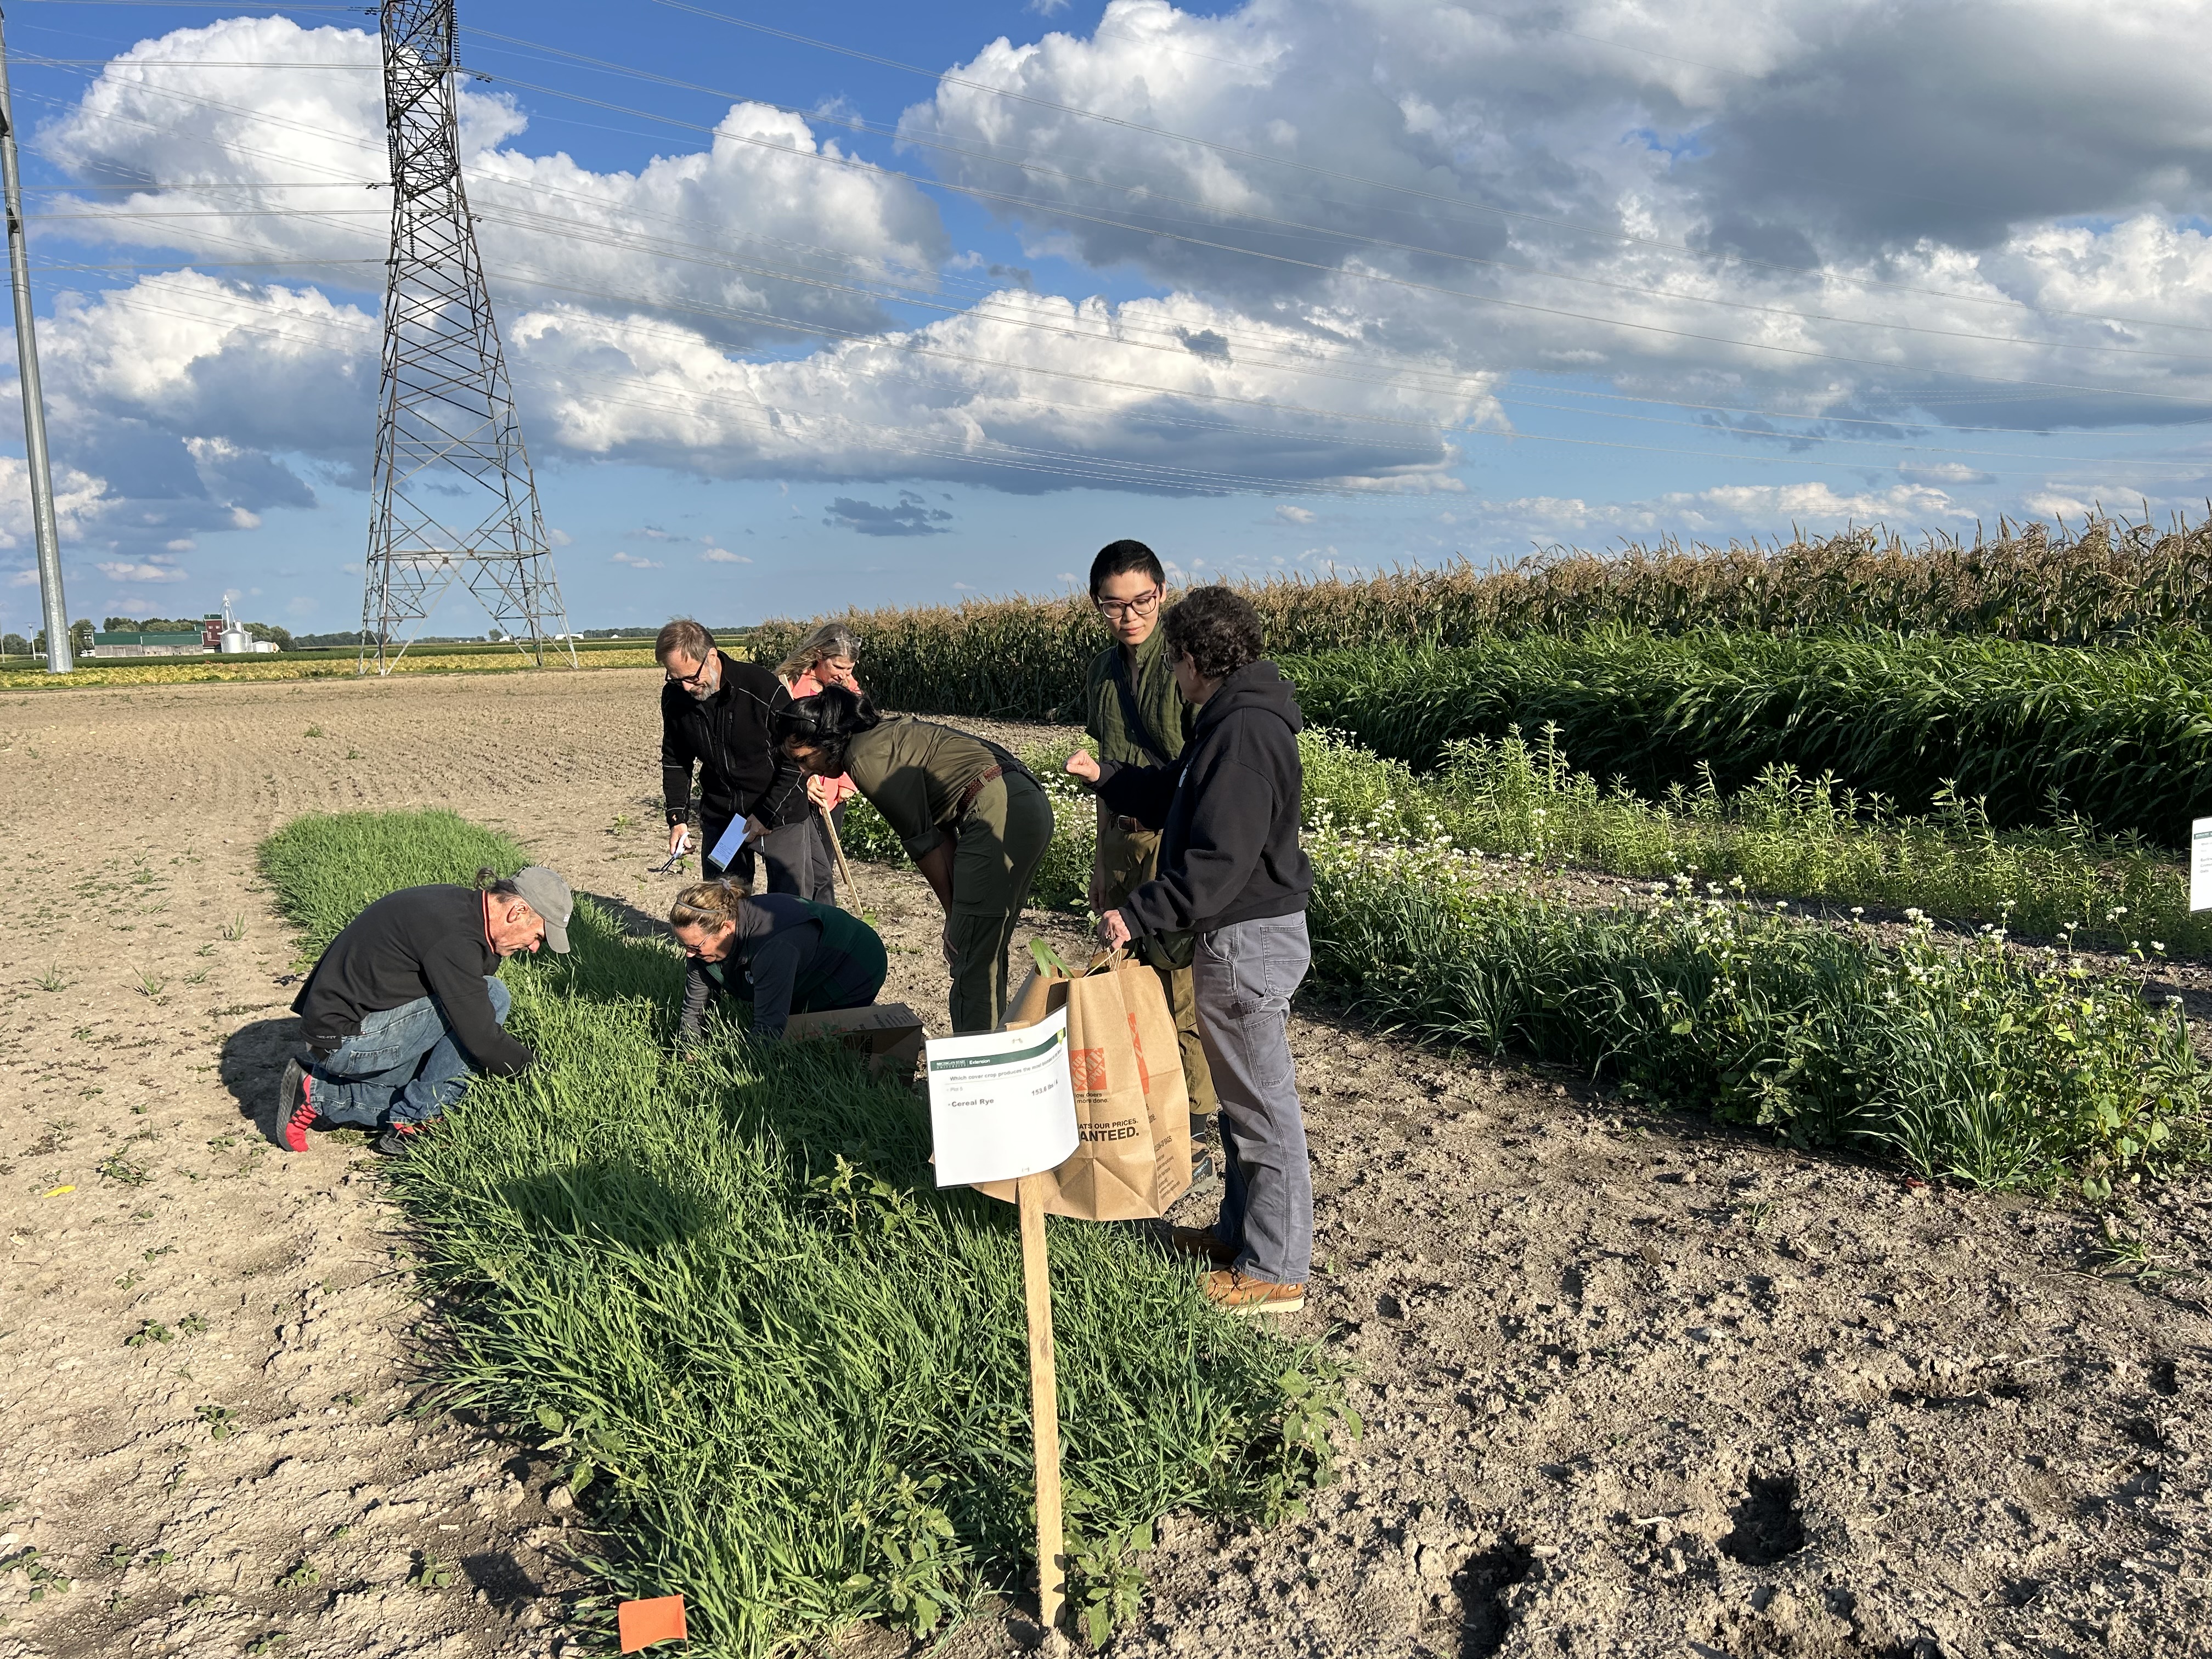
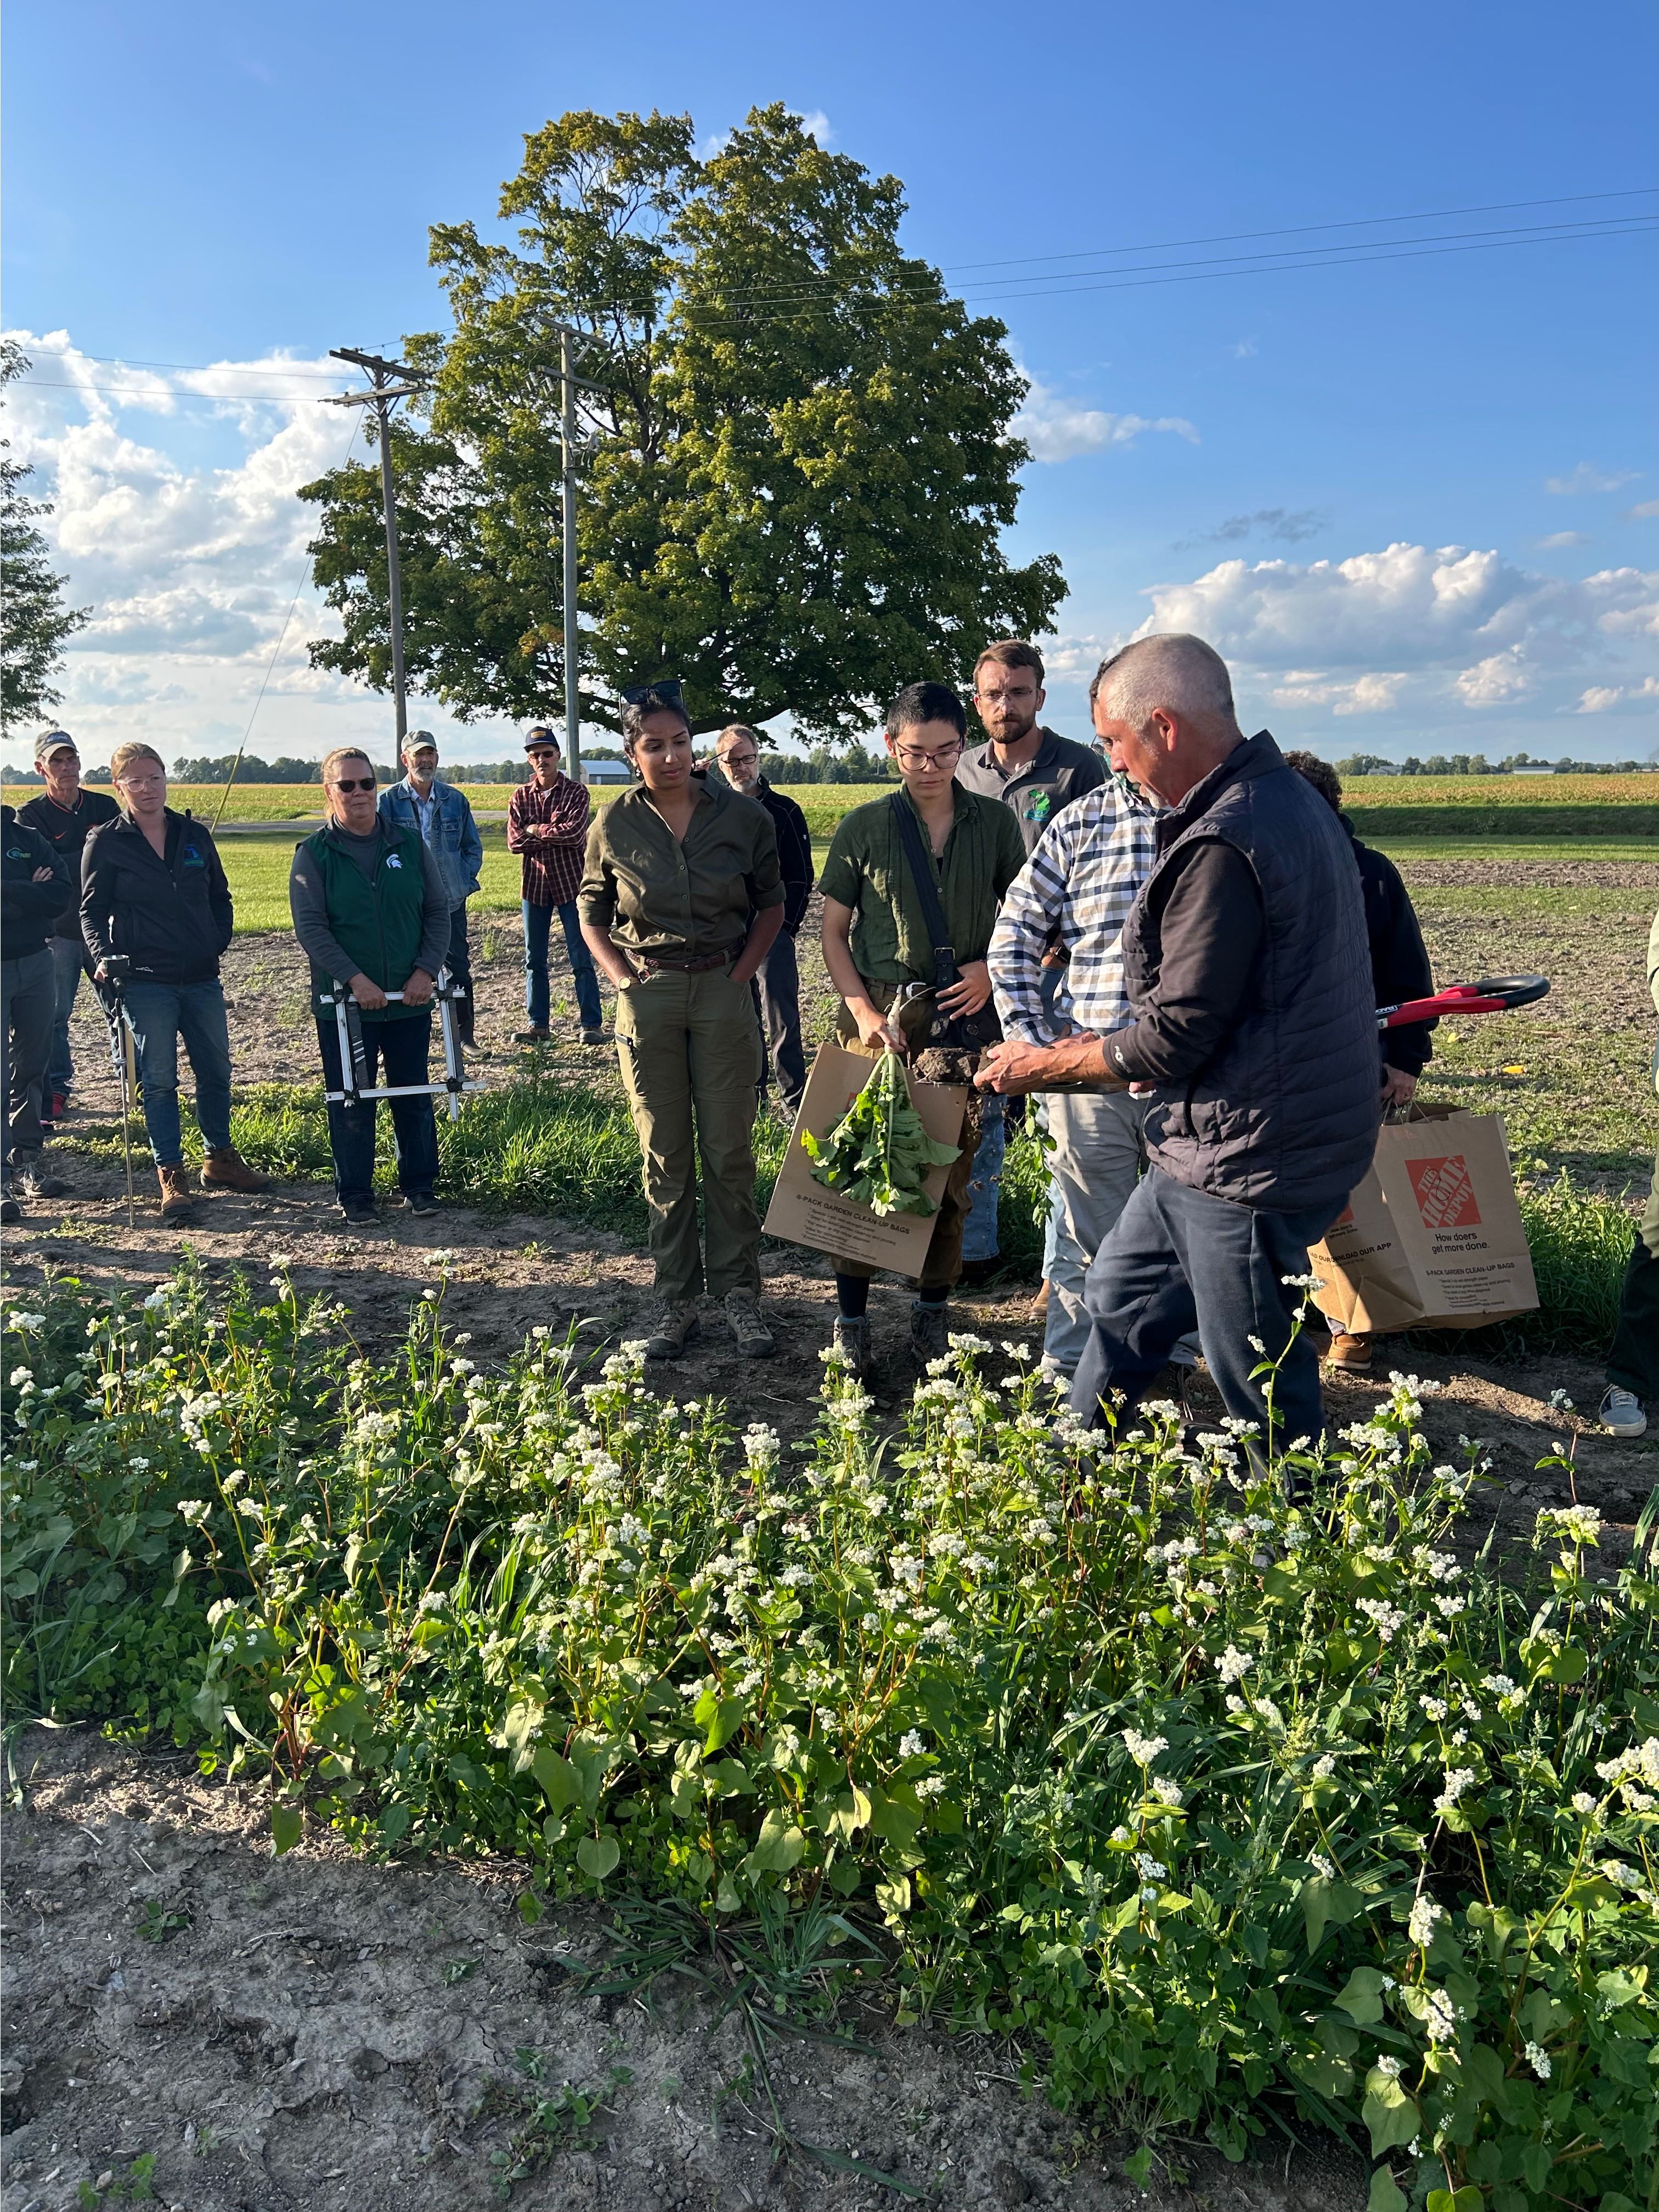
Participants attending a hands-on workshop at SVREC in September 2025 were shown photographs of cover crop plots and asked to estimate dry matter production. Most estimates exceeded actual biomass measurements by at least two-fold. The exercise demonstrated visual assessments, while useful, may not accurately reflect the amount of plant material growing in a field, thus it is difficult to predict the potential benefit of the cover crop.
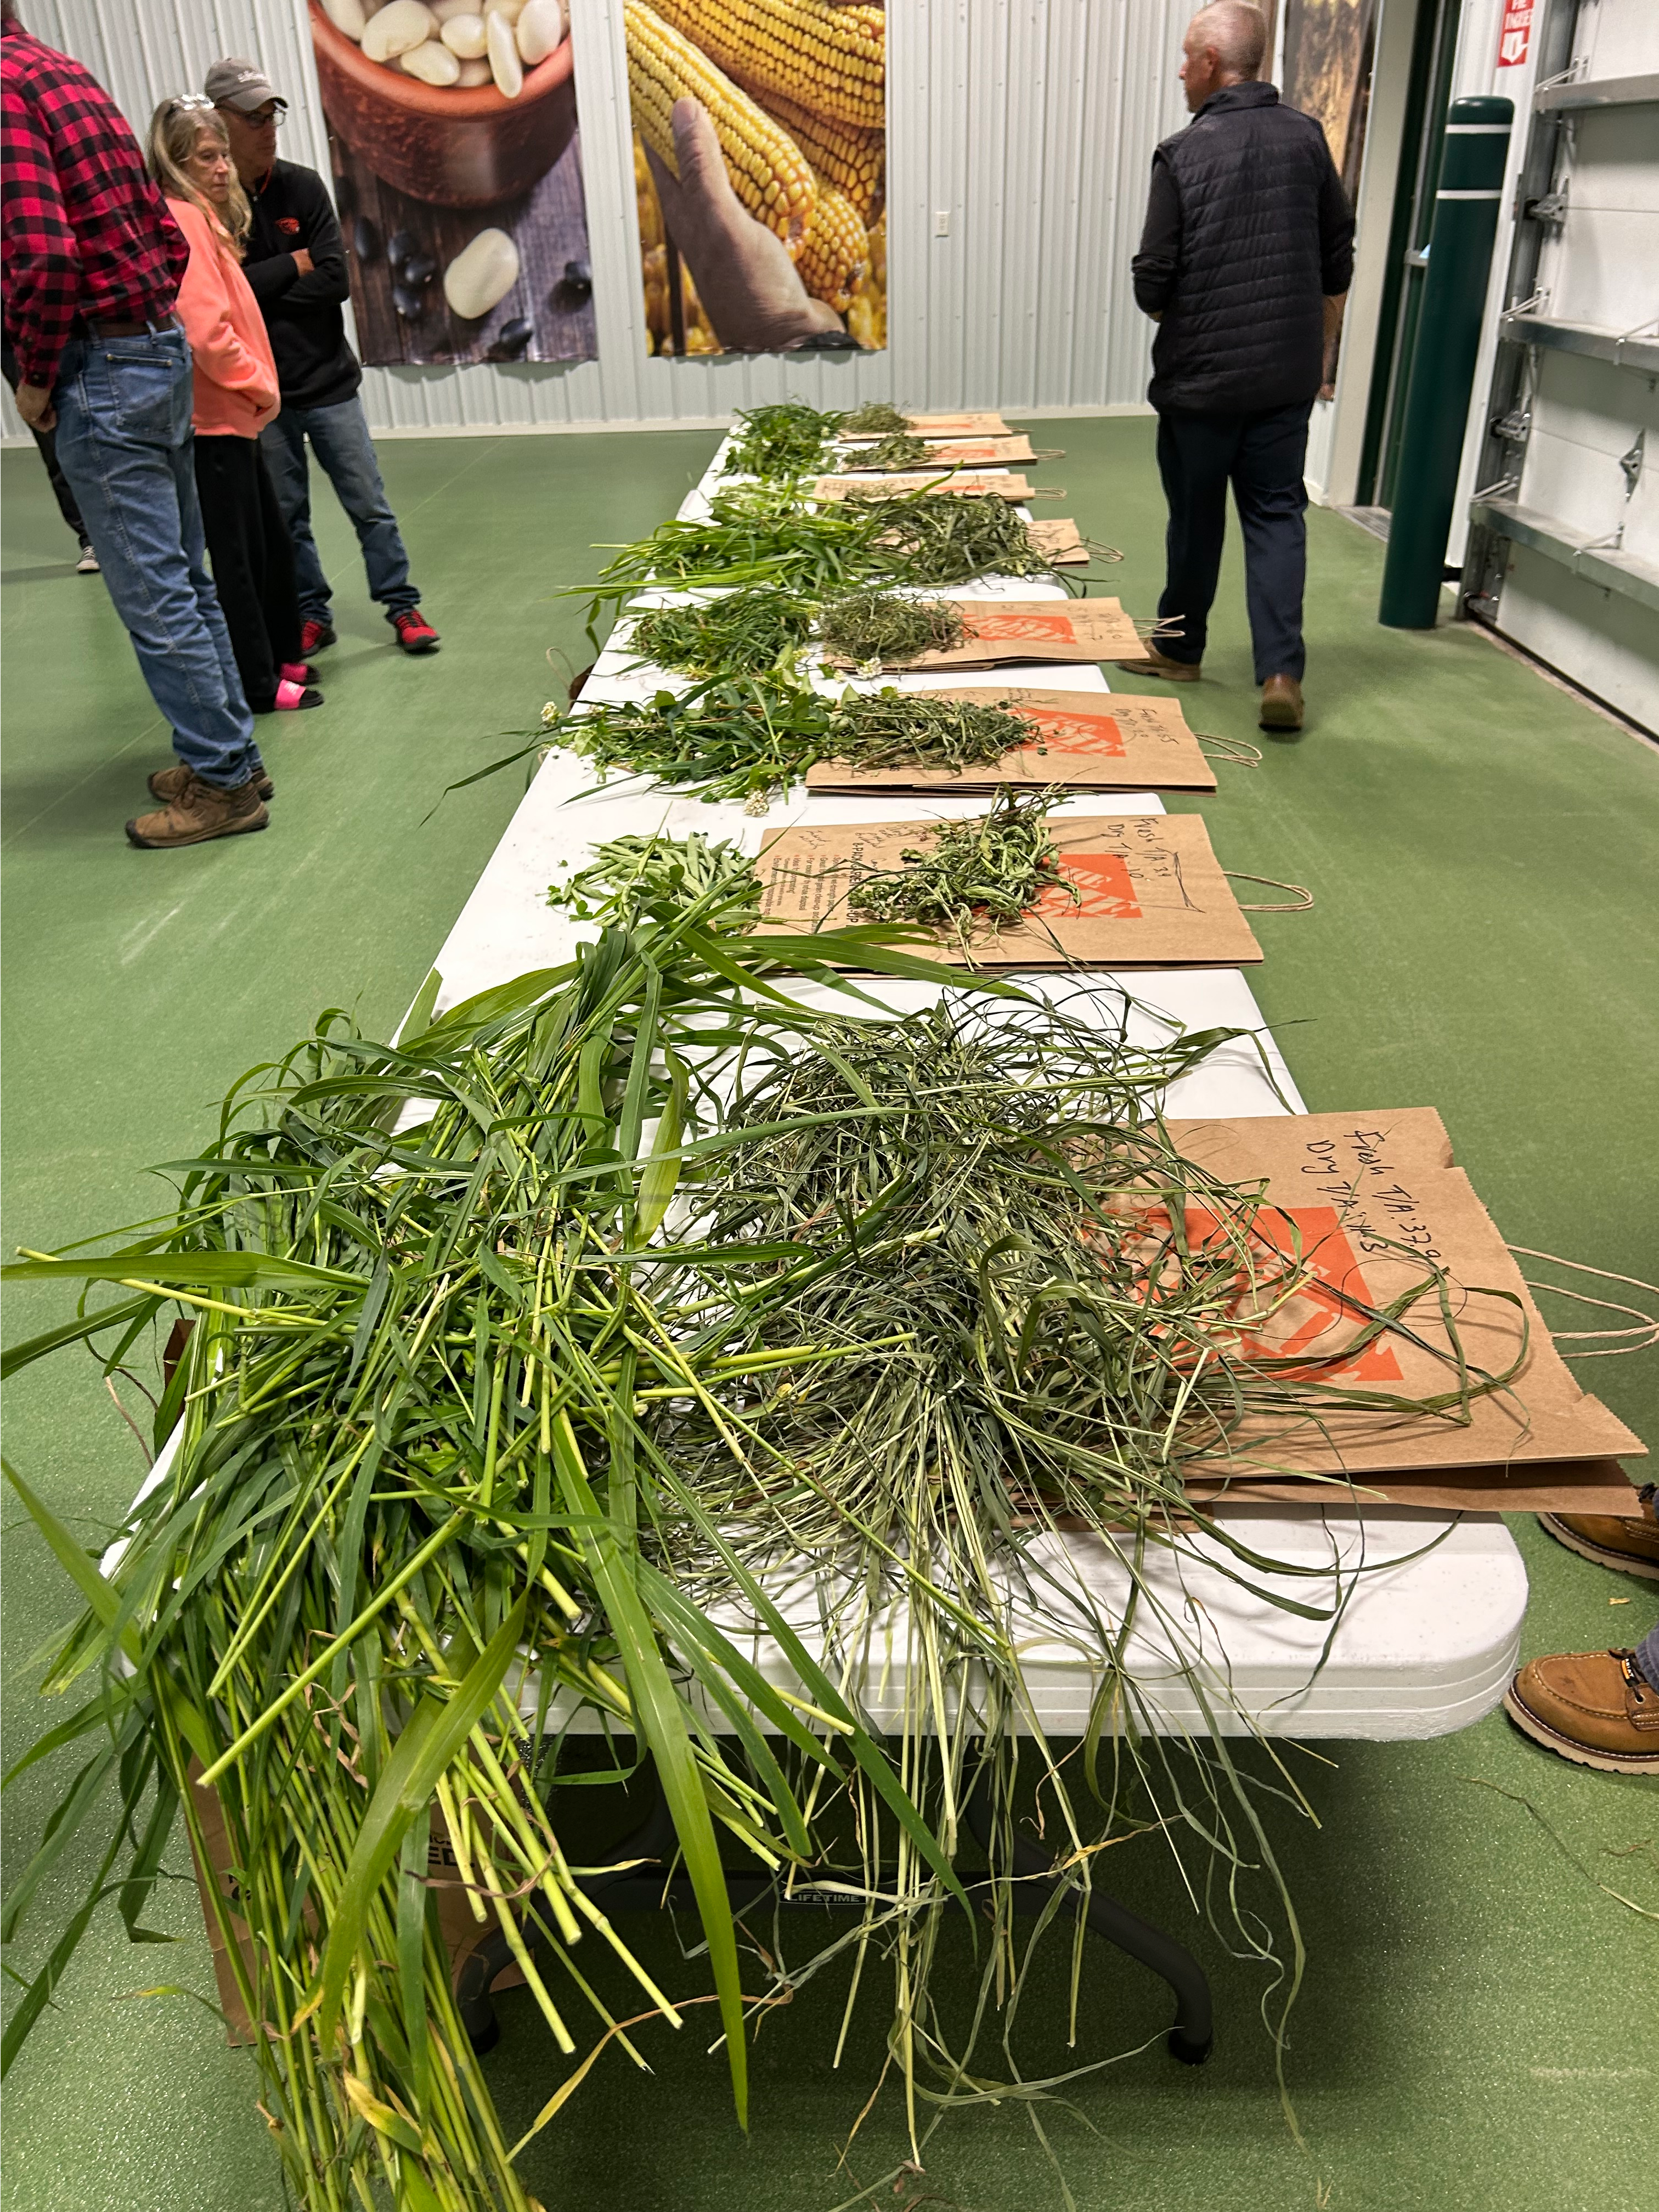
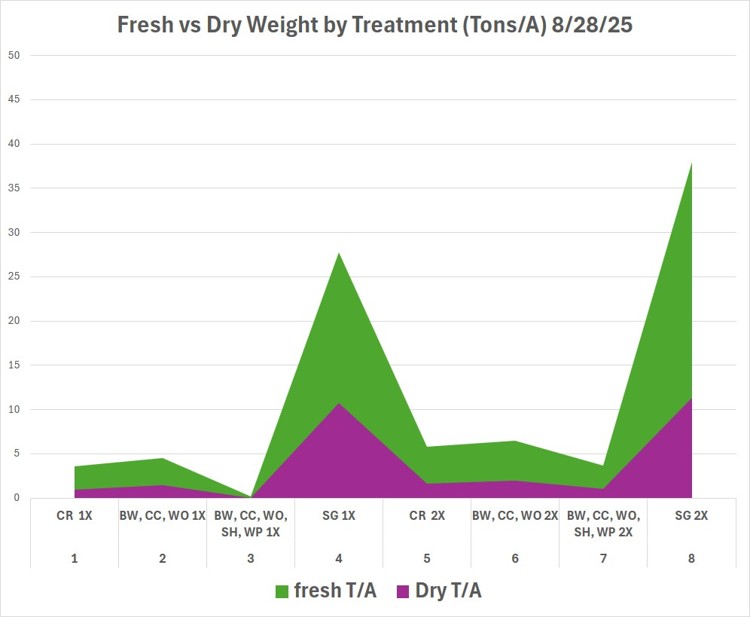
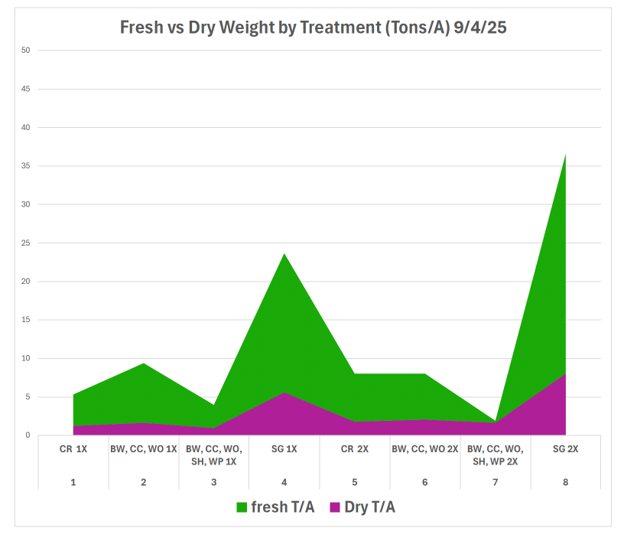
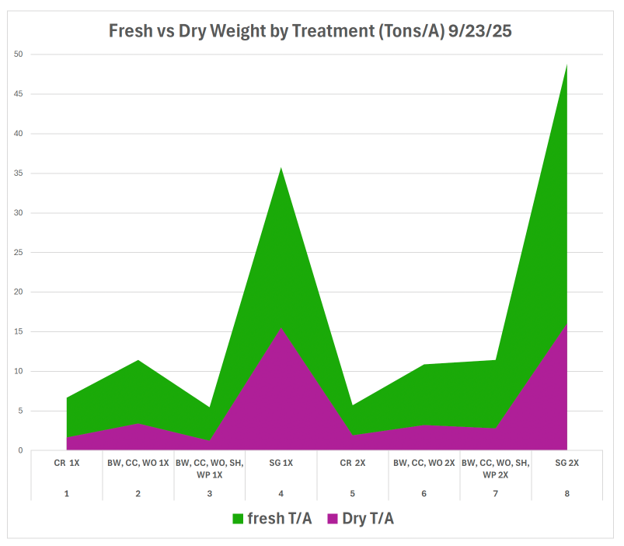
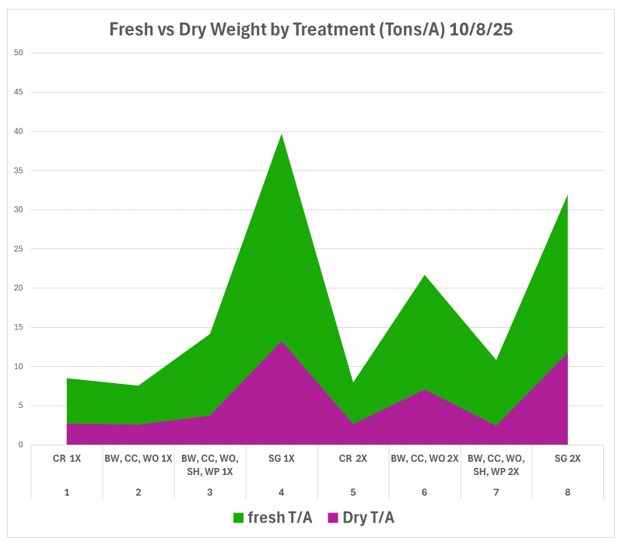
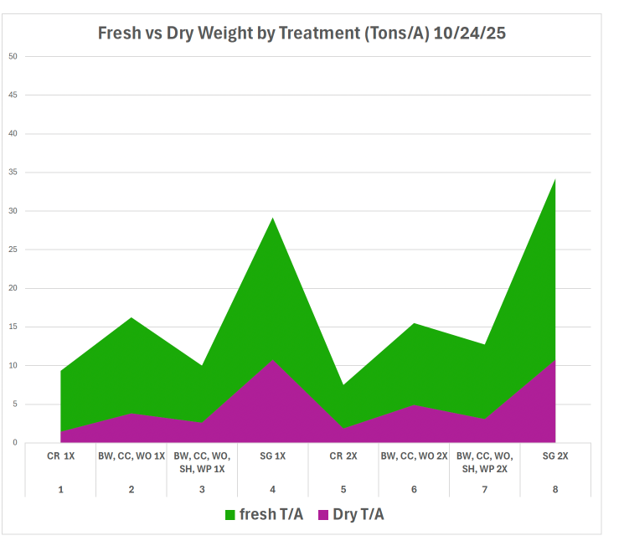
Through field sampling hands-on activities, participants collected biomass samples, compared wet and dry weights (the dry weight biomass was collected a week before the workshop so participants could see the difference), and learned practical methods for calculating biomass production. These measurements provided a clearer understanding of cover crop performance and highlighted the value of using objective data when making management decisions (Figures 1-5).
Which species produced the most biomass?
These demonstration plots included cereal rye, buckwheat, crimson clover, white oats, sunn hemp, winter pea, and sorghum-sudangrass (Table 1). Biomass samples were collected on five dates of each species throughout the season to track growth and development.
Among these species, sorghum-sudangrass consistently produced the greatest wet and dry biomass across sampling dates; rapid growth and the ability to generate large amounts of residue, make sorghum-sudangrass an attractive option for producers seeking maximum biomass production during the summer growing season. The environmental conditions were favorable for sorghum-sudangrass as we experienced hot and dry summer and fall.
At the same time, the demonstration reinforced biomass production is only one consideration. Other species may offer other advantages depending on management goals, including nitrogen fixation, winter hardiness, pollinator benefits, and establishment ease.
Weather influenced performance
Weather conditions played a key role in cover crop growth during the 2025 season. From July through early October, conditions at SVREC were warmer and drier compared to average. July and August were characterized by sustained heat, high humidity, and uneven rainfall distribution. Dry conditions persisted through September and early October, creating moisture stress in the demonstration plots.
By mid-October, cooler temperatures and more consistent rainfall returned, bringing conditions closer to historic norms. These seasonal fluctuations influenced growth rates and biomass accumulation across all cover crop treatments, illustrating how weather can affect cover crop performance from year to year. Thus, supporting the benefit of growing several cover crop species together.
Looking beyond biomass
Researchers also examined plant tissue samples to better understand how each cover crop species differs in their ability to uptake nutrients and store them. Results showed significant differences among species and mixtures for primary, secondary, and micronutrients (Table 2). Although each plot occupied the same amount of space, due to variations in biomass production substantial differences were observed in total nutrient accumulation.
Table 2. The tissue analysis identified the different nutrients from the combined treatments/ species plots. The different plots were the same size, yet had vastly different composition of primary, secondary and micronutrient percentages. These differences were dependent on biomass amount and crop species. Treatment abbreviations: CR = cereal rye, BW = buckwheat, CC = crimson clover, WO = white oats, SH = Sunn hemp, WP = winter pea, SG = Sudan grass. The above ground biomass is calculated by weight taken from a 12-inch square sampling area and converted to tons/A.
|
Measurement |
Results |
|||
|---|---|---|---|---|
|
CR |
BW, CC, WO |
BW, CC, WO, SH, WP |
SG |
|
|
dry weight g |
70.13 |
86.54 |
32.09 |
280.93 |
|
Nitrogen % |
3.59 |
2.57 |
2.45 |
2.01 |
|
Total carbon % |
42.4 |
41.4 |
42.6 |
42.4 |
|
C:N ratio |
11.8:1 |
16.1:1 |
17.4:1 |
21.1:1 |
|
Sulphur % |
0.30 |
0.23 |
0.27 |
0.15 |
|
Phosphorus % |
0.40 |
0.38 |
0.43 |
0.26 |
|
Potassium % |
4.57 |
4.22 |
2.73 |
4.03 |
|
Magnesium % |
0.40 |
0.58 |
0.56 |
0.35 |
|
Calcium % |
1.01 |
1.40 |
1.78 |
0.59 |
|
Sodium % |
0.01 |
0.01 |
0.01 |
0.01 |
|
Boron ppm |
10 |
20 |
27 |
3 |
|
Zinc ppm |
29 |
28 |
32 |
30 |
|
Manganese ppm |
32 |
30 |
27 |
16 |
|
Iron ppm |
607 |
298 |
175 |
88 |
|
Copper ppm |
10 |
8 |
10 |
8 |
|
Aluminum ppm |
488 |
264 |
153 |
41 |
|
Measurement |
Amount lbs/A |
|||
|---|---|---|---|---|
|
CR |
BW, CC, WO |
BW, CC, WO, SH, WP |
SG |
|
|
Biomass |
1682 |
2076 |
770 |
6739 |
|
Nitrogen |
60.4 |
53.3 |
18.9 |
135.2 |
|
Total carbon |
713 |
859 |
328 |
2859 |
|
C:N ratio |
N/A |
N/A |
N/A |
N/A |
|
Sulphur |
5.0 |
4.8 |
2.1 |
10.2 |
|
Phosphorus (P2O5) |
15.4 |
18.1 |
7.5 |
39.7 |
|
Potassium (K2O) |
92.3 |
105.2 |
25.3 |
325.6 |
|
Magnesium |
6.7 |
12.0 |
4.3 |
23.9 |
|
Calcium |
17.1 |
29.0 |
13.7 |
39.6 |
|
Sodium |
0.2 |
0.2 |
0.1 |
0.7 |
|
Boron |
0.017 |
0.042 |
0.021 |
0.023 |
|
Zinc |
0.049 |
0.059 |
0.025 |
0.204 |
|
Manganese |
0.054 |
0.062 |
0.021 |
0.107 |
|
Iron |
1.02 |
0.62 |
0.13 |
0.60 |
|
Copper |
0.017 |
0.016 |
0.008 |
0.051 |
|
Aluminum |
0.82 |
0.55 |
0.12 |
0.28 |
Ground-cover measurements were evaluated using Canopeo application image analysis software (Table 3). The application measures green canopy cover percentages for crops, turf and cover crops using downward-facing photos. While many treatments achieved similar levels of canopy coverage, biomass production varied among species. These findings suggest visual canopy cover alone is not a reliable indicator of total biomass production or nutrient contribution.
Table 3. The Canopeo application is a canopy cover measurement tool which quantifies the percent of canopy cover of living green vegetation. Below are the measurements from two different dates.
|
Trt |
8/28/2025 |
10/24/2025 |
|---|---|---|
|
1 |
80.7 |
62.3 |
|
2 |
81.4 |
71.0 |
|
3 |
8.6 |
62.1 |
|
4 |
93.9 |
83.3 |
|
5 |
86.0 |
60.9 |
|
6 |
83.5 |
49.3 |
|
7 |
81.7 |
82.2 |
|
8 |
99.8 |
87.0 |
Soil health results
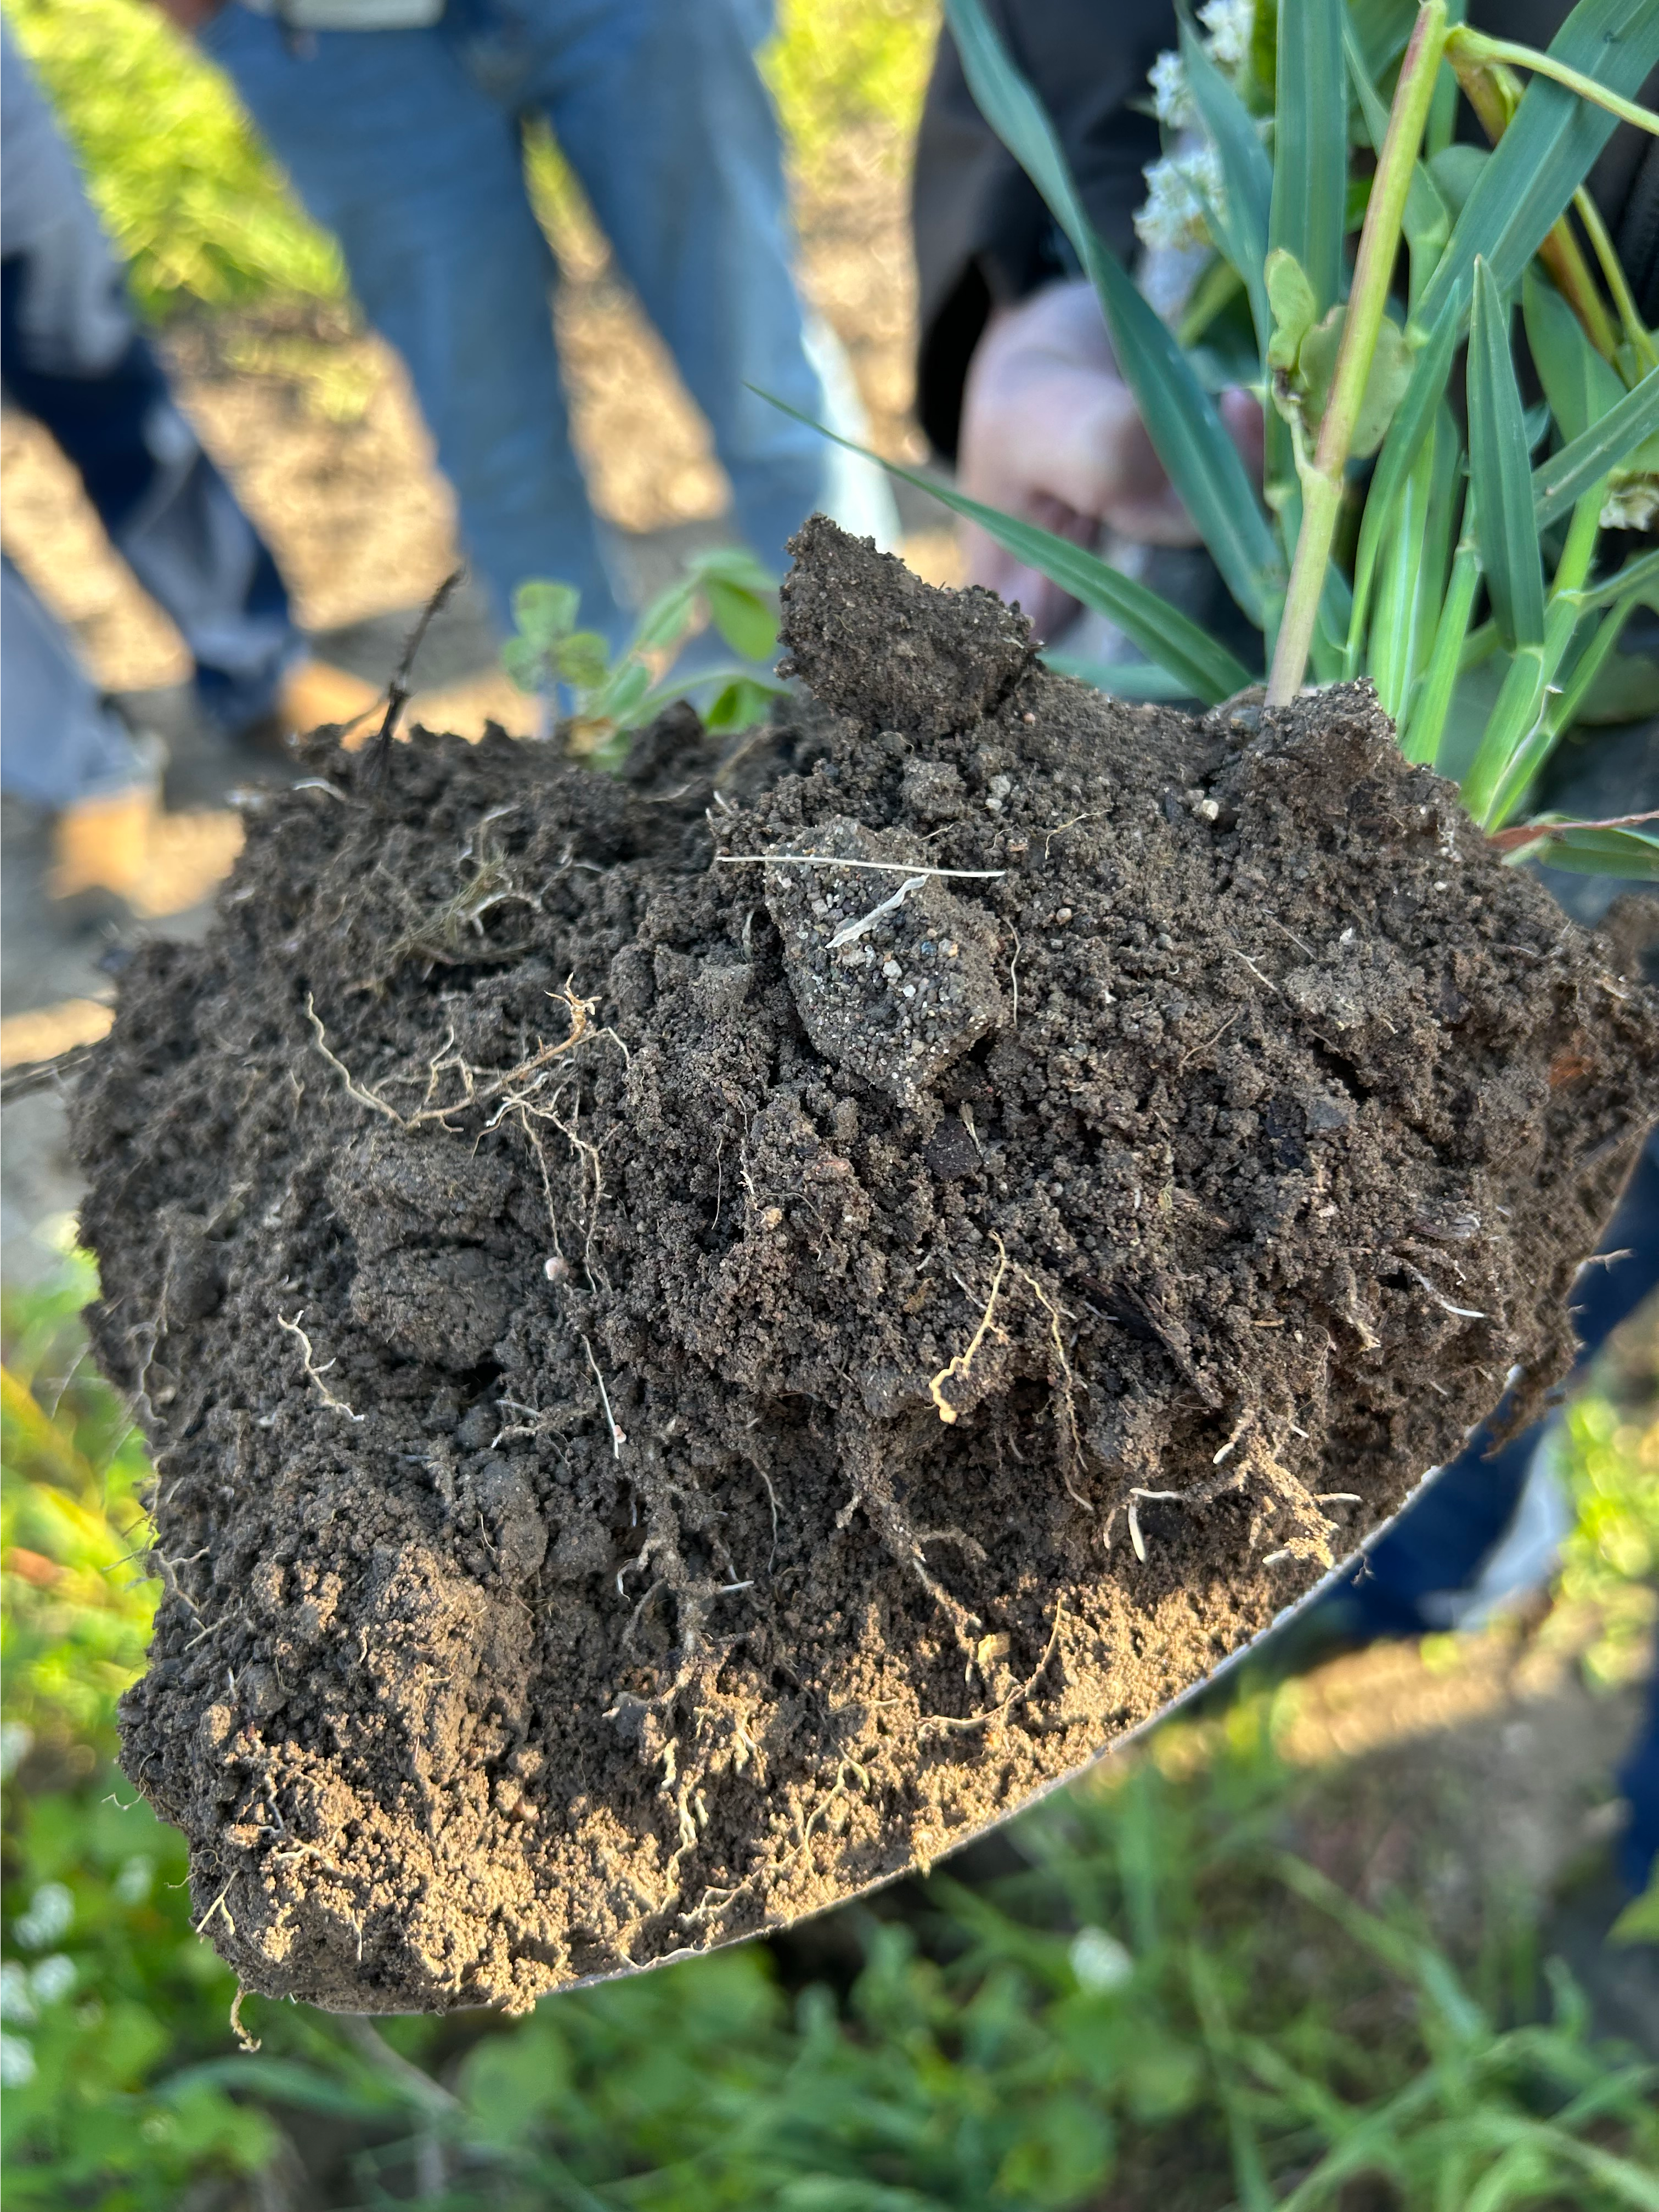
The demonstration also provided an opportunity to compare soil health across different management systems. Soil samples collected from a tilled pickle field, a nearby field managed with cover crops, and an undisturbed ditch bank were analyzed by Cornell University's Soil Health Laboratory.
The tilled field received a soil health score of 47, while the field with cover crops scored 54. The undisturbed ditch bank received a score of 83. Regular tillage disrupts soil structure, reduces habitat for organisms that live in the soil, and can accelerate the loss of organic matter. The cover crop plot had a slightly higher score indicating that soil health is improving due to living roots that feed microbes, protect the soil surface from erosion, increase organic matter, and improve aggregation. The undisturbed ditch bank had the highest score and indicated that soil is healthier and continuous vegetation and higher organic matter accumulation over several years. While many factors influence soil health, the results align with decades of research showing that reducing soil disturbance and maintaining living roots can improve soil health over time.
Matching cover crops to farm goals
The most important takeaway from the demonstration is no single "best" cover crop exists. A species excelling at producing biomass may not be the best choice for nitrogen fixation, quality forage production, or fall establishment. Successful cover crop adoption begins with identifying management goals and selecting species aligning with those goals.
As interest in soil health and regenerative agriculture continues to grow, demonstrations like this one provide valuable local information helping producers make informed management decisions and improve the long-term resilience of their farming operations.
Acknowledgments
We gratefully acknowledge the support of the 2025 “Learn. Conserve. Farm.” grant, which made this event possible. Funding covered essential supplies such as sample bags, scissors, printing materials, refreshments, and tissue analysis. The “Cover Crops Field Guide” (third edition) from Purdue was provided to participants upon request. Cover crop seed was generously donated, and the scale used for weighing biomass samples was borrowed. The SVREC farm and personnel for allowing our demonstration plots.
This event is made possible through the 2025 “Learn. Conserve. Farm.” grant with funding support from Michigan Farm Bureau; Corn Marketing Program of Michigan; GreenStone Farm Credit Services; Michigan Milk Producers Association; Michigan Pork Producers Association and Michigan State University Extension.