MSU Extension releases grain market benchmarks report
 Print
Print Email
EmailMarket price data may hold the key to maximizing sales.

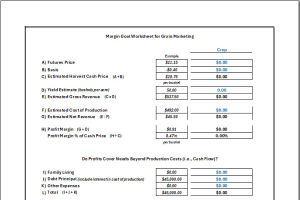
Historical grain prices and their trends often help in deciding when a good time is to sell. Marketing strategies often work best when target dates or decision deadlines are aligned with periods of expected peak pricing. The same price data can also help to determine planting intentions as potential profits impact final crop acres. Even more helpful is if the market data is based on state markets instead of the national baseline.
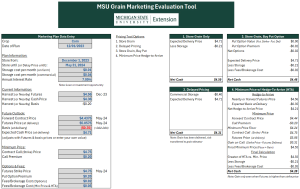
The Michigan Grain Market Benchmarks report by Michigan State University Extension is a summary of price data from the U.S. Department of Agriculture (USDA) National Agricultural Statistics Service (NASS). Commodities included in the report are corn, soybeans and wheat dating back to 1980. Prices included are based on monthly cash prices received for Michigan growers, an average calendar average, and a marketing year average for each commodity.
Note: Marketing year average prices are a weighted average released by USDA NASS influenced by percentage of sales during the marketing year. Marketing years for corn and soybeans begin on Sept. 1 and end Aug. 31. The marketing year for wheat begins on June 1 and ends May 31.
In addition to the price data, several graphs outline price trends for all three commodities. A graph outlining the historical trend of Michigan’s corn/soybean ratio is also provided in the report. All graphs are based on market year average prices.
The Michigan Grain Market Benchmarks report will be updated monthly as new data becomes available from the USDA. Check back each month for the latest pricing data for Michigan crops.