Scanner data show beef and pork producers capture a larger share of retail sales
 Print
Print Email
EmailUsing retail scanner data in place of publicly available data to calculate farmers’ share of the retail dollar reveals farmers receive, on average, 9.0 and 3.1 percentage points more of retail beef and pork dollars, respectively.
This research was supported in part by the U.S. Department of Agriculture, Economic Research Service. The findings and conclusions in this publication are those of the authors and should not be construed to represent any official USDA or U.S. government determination or policy.
Farmers’ share of the retail dollar is not a good indicator of livestock producer well-being. Value additions along the meat supply chain can increase retail prices, which in turn may decrease farmers’ share. However, increases in meat demand—driven by final-product value additions—can ultimately leave livestock producers better off. Regardless, farmers’ share statistics are widely cited by the media and occasionally used in policymaking.
Farmers’ share statistics are calculated by dividing the retail-equivalent price at the farmgate by the price of the end-product at retail. The data underlying retail meat prices and used in farmers’ share calculations are typically obtained from the U.S. Bureau of Labor Statistics (BLS). These prices are compiled after BLS data collectors visit retail stores across the country and record the posted price for a multitude of goods, including many meat products.
Retail scanner data offer an alternative to BLS retail meat price data. Unlike BLS data, retail scanner data include quantities purchased at various prices, so quantity-weighted average prices can be determined. This is an important distinction because consumers are more likely to purchase a greater quantity of meat products when they are on sale. Therefore, the average price paid per pound of meat may be less than the BLS observed prices in retail stores.
Scanner-based, quantity-weighted meat prices are lower than BLS estimates
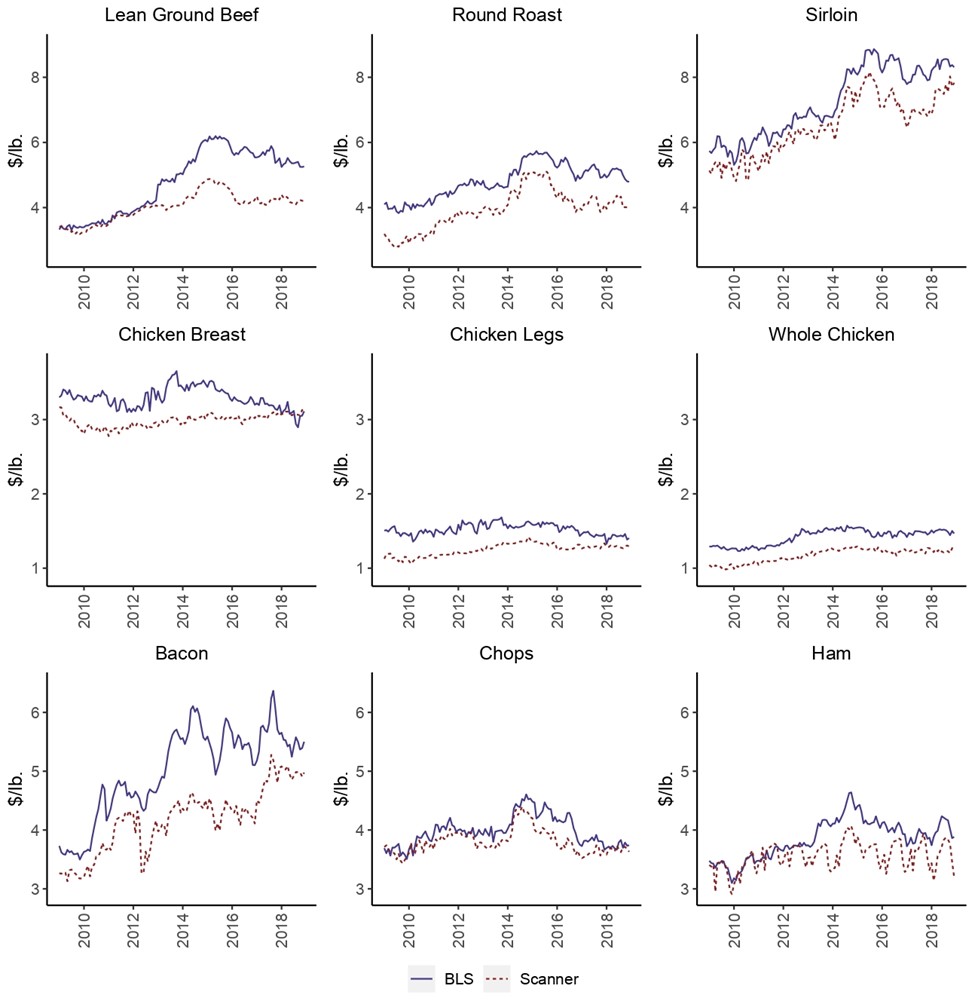
Using Circana OmniMarket Core Outlets' random-weight scanner data, quantity-weighted prices are calculated for a suite of beef, chicken and pork products spanning January 2009 to December 2018. These price series are then compared to BLS estimates over the same period. Results are graphed in Figure 1. For nearly all observations (96%), retail prices reported by BLS were greater than quantity-weighted prices calculated using scanner data. The difference between series averages is greatest for round roast ($0.87/lb.) and bacon (84¢/lb.) and least for pork chops ($0.18/lb.) and whole chicken ($0.25/lb.).
Figure 1. Monthly Retail Meat Prices Based on BLS and Scanner Data (2009 – 2018)
USDA Economic Research Service (ERS) uses BLS prices to calculate aggregate retail prices for beef, chicken, and pork categories. These aggregate prices are then used to calculate farmers’ share statistics. Following an approach akin to ERS’s process, the quantity-weighted scanner price series are used to calculate aggregate retail prices for beef, chicken and pork categories. Retail prices resulting from this calculation—as well as farm, wholesale and retail prices reported by ERS—are illustrated in Figure 2.
Figure 2. Monthly Farm, Wholesale and Retail Prices (2009 – 2018)
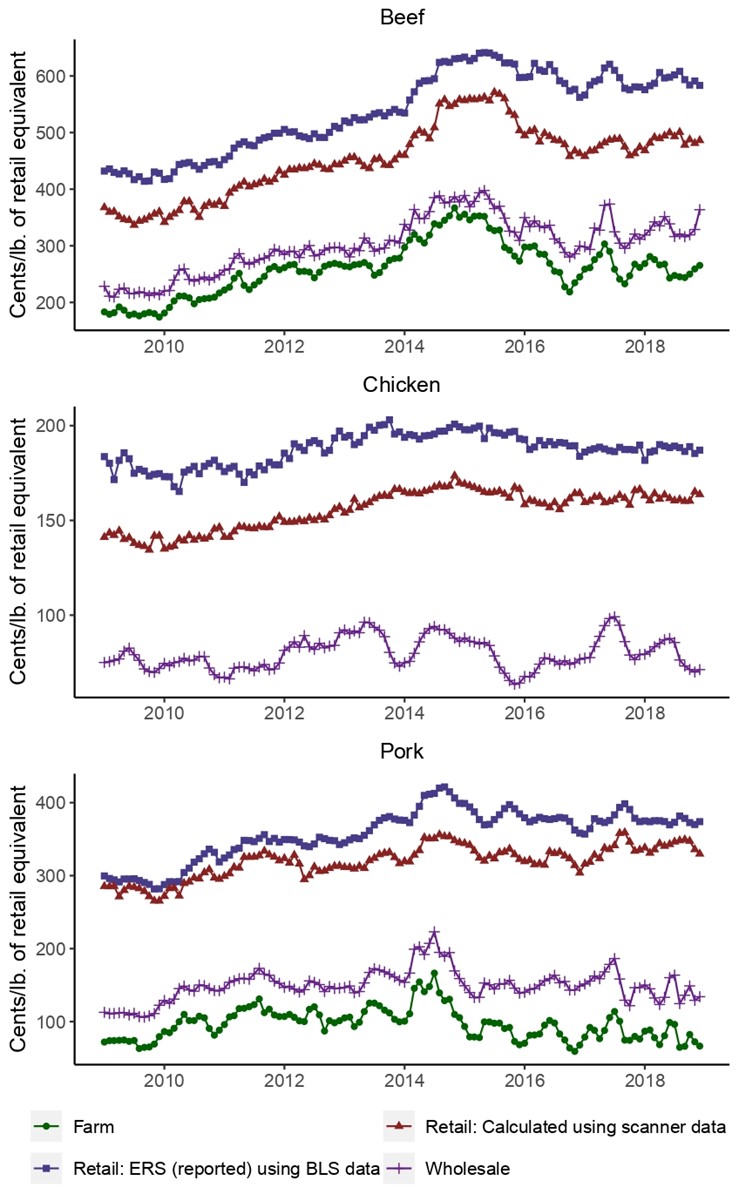
As shown in Figure 2, aggregate retail prices for beef, chicken and pork calculated using scanner data are less than those reported by ERS (that are derived from BLS data). Compared to ERS-reported values, beef farm-to-retail and wholesale-to-retail price spreads based on scanner data are on average 30.5% and 36.0% smaller, respectively. For chicken, wholesale-to-retail price spreads are on average 29.8% smaller when measured using scanner data. Because farm prices for chicken are not available, farm-to-retail price spreads are not calculated. For pork, farm-to-retail and wholesale-to-retail price spreads are on average 14.2% and 17.9% smaller, respectively.
Scanner data reveal higher retail shares for beef and pork producers
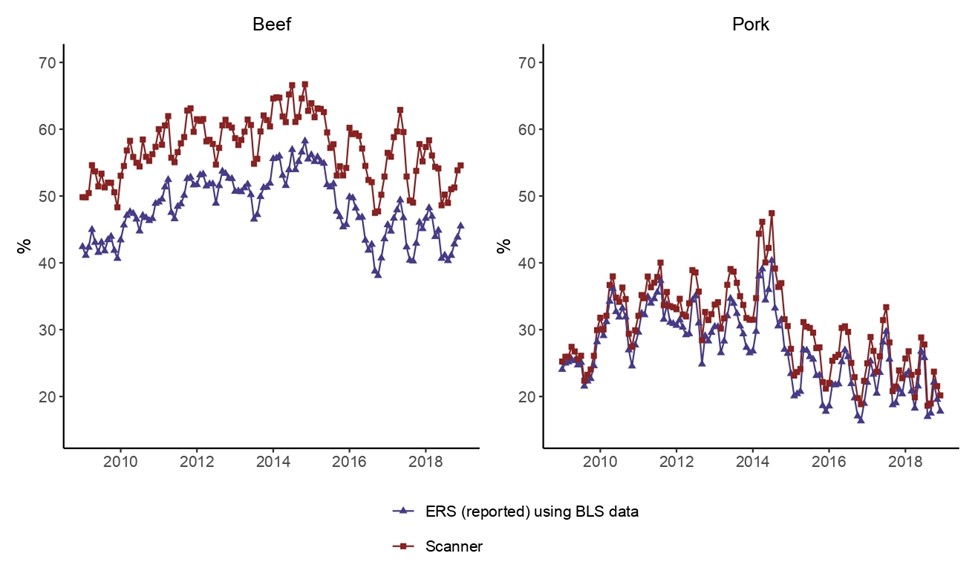
Farmers’ share statistics are calculated using both the scanner and the ERS-reported aggregate retail price series for beef and pork. Figure 3 graphs the calculated farmers’ share measures over time. When estimated using scanner-based versus BLS prices, farmers receive, on average, 9.0 and 3.1 percentage points more of the retail beef and pork dollars, respectively.
Figure 3. Farmers’ Share of the Retail Dollar Calculated Using ERS-Reported and Scanner-Based Prices (2009 – 2018)
In 2022, proposed legislation (H.R. 8590, Small Family Farmer and Rancher Relief Act) would have made payments to beef producers when farmers’ share statistics fell below a certain threshold. If this policy had been active in 2009 through 2018, indemnity payments would have occurred 5.2 times more frequently if using farmers’ share statistics calculated with BLS retail price data versus quantity-weighted retail scanner price data. Hence, farmers’ share statistics are not well-suited for policy making and should be viewed with caution given their dependence on the choice of data used in their calculation.
Ultimately, both publicly available BLS data and proprietary retail scanner data possess advantages and disadvantages. Yet, the results of this study suggest that their use leads to differing outcomes when used in practice. Perhaps next time you see a farmers’ share statistic quoted in the news, you’ll take a moment to ask yourself, “Do these statistics really mean anything at all?”
Please note that details of the full study are featured in the article “ What's the price of meat? Sources of variation in retail meat price data and impacts on market performance analysis,” published on the Journal of the Agricultural and Applied Economics Association website. The full article was authored by Jaime Luke (Michigan State University), Ted Schroeder (Kansas State University), Glynn Tonsor (Kansas State University), LaPorchia Collins (Tufts University), and Danielle Ufer (USDA Economic Research Service).