Thinking about collecting yield data with your combine?
 Print
Print Email
EmailFarmers wanting to collect and manage yield data during harvest this fall should prepare early to get equipment ready and pathways cleared for data transfer and storage. This article will walk through important considerations for this process.
There are two general ways to measure yield during grain harvest. The simplest, low-tech method is to transfer each load from the combine to a grain cart equipped with load cells or a truck that is then taken to local scales to get a per-load weight. In this case, a grain sample should be measured with a calibrated moisture tester to calculate bushels per acre at standard moisture levels (13% for soybean, 15.5% for corn, 13.5% for wheat).
Yield can only be determined for the area harvested with a given load, or for the entire field, which is perfectly fine if that is your only goal. However, to take measurements continuously across the field to generate a yield map, a system of yield monitoring must be in place and maintained properly. We work with farmers using both methods in the Michigan Soybean On-Farm Research Program. However, this article will focus on the latter system.
Yield monitors have been available since the early 1990s, although for many years most farmers were only generating “pretty pictures” of yield with little actionable usefulness. More recently, farmers and agronomists have been using yield data to create management zones and prescriptions for planting and making applications of lime and fertilizer.
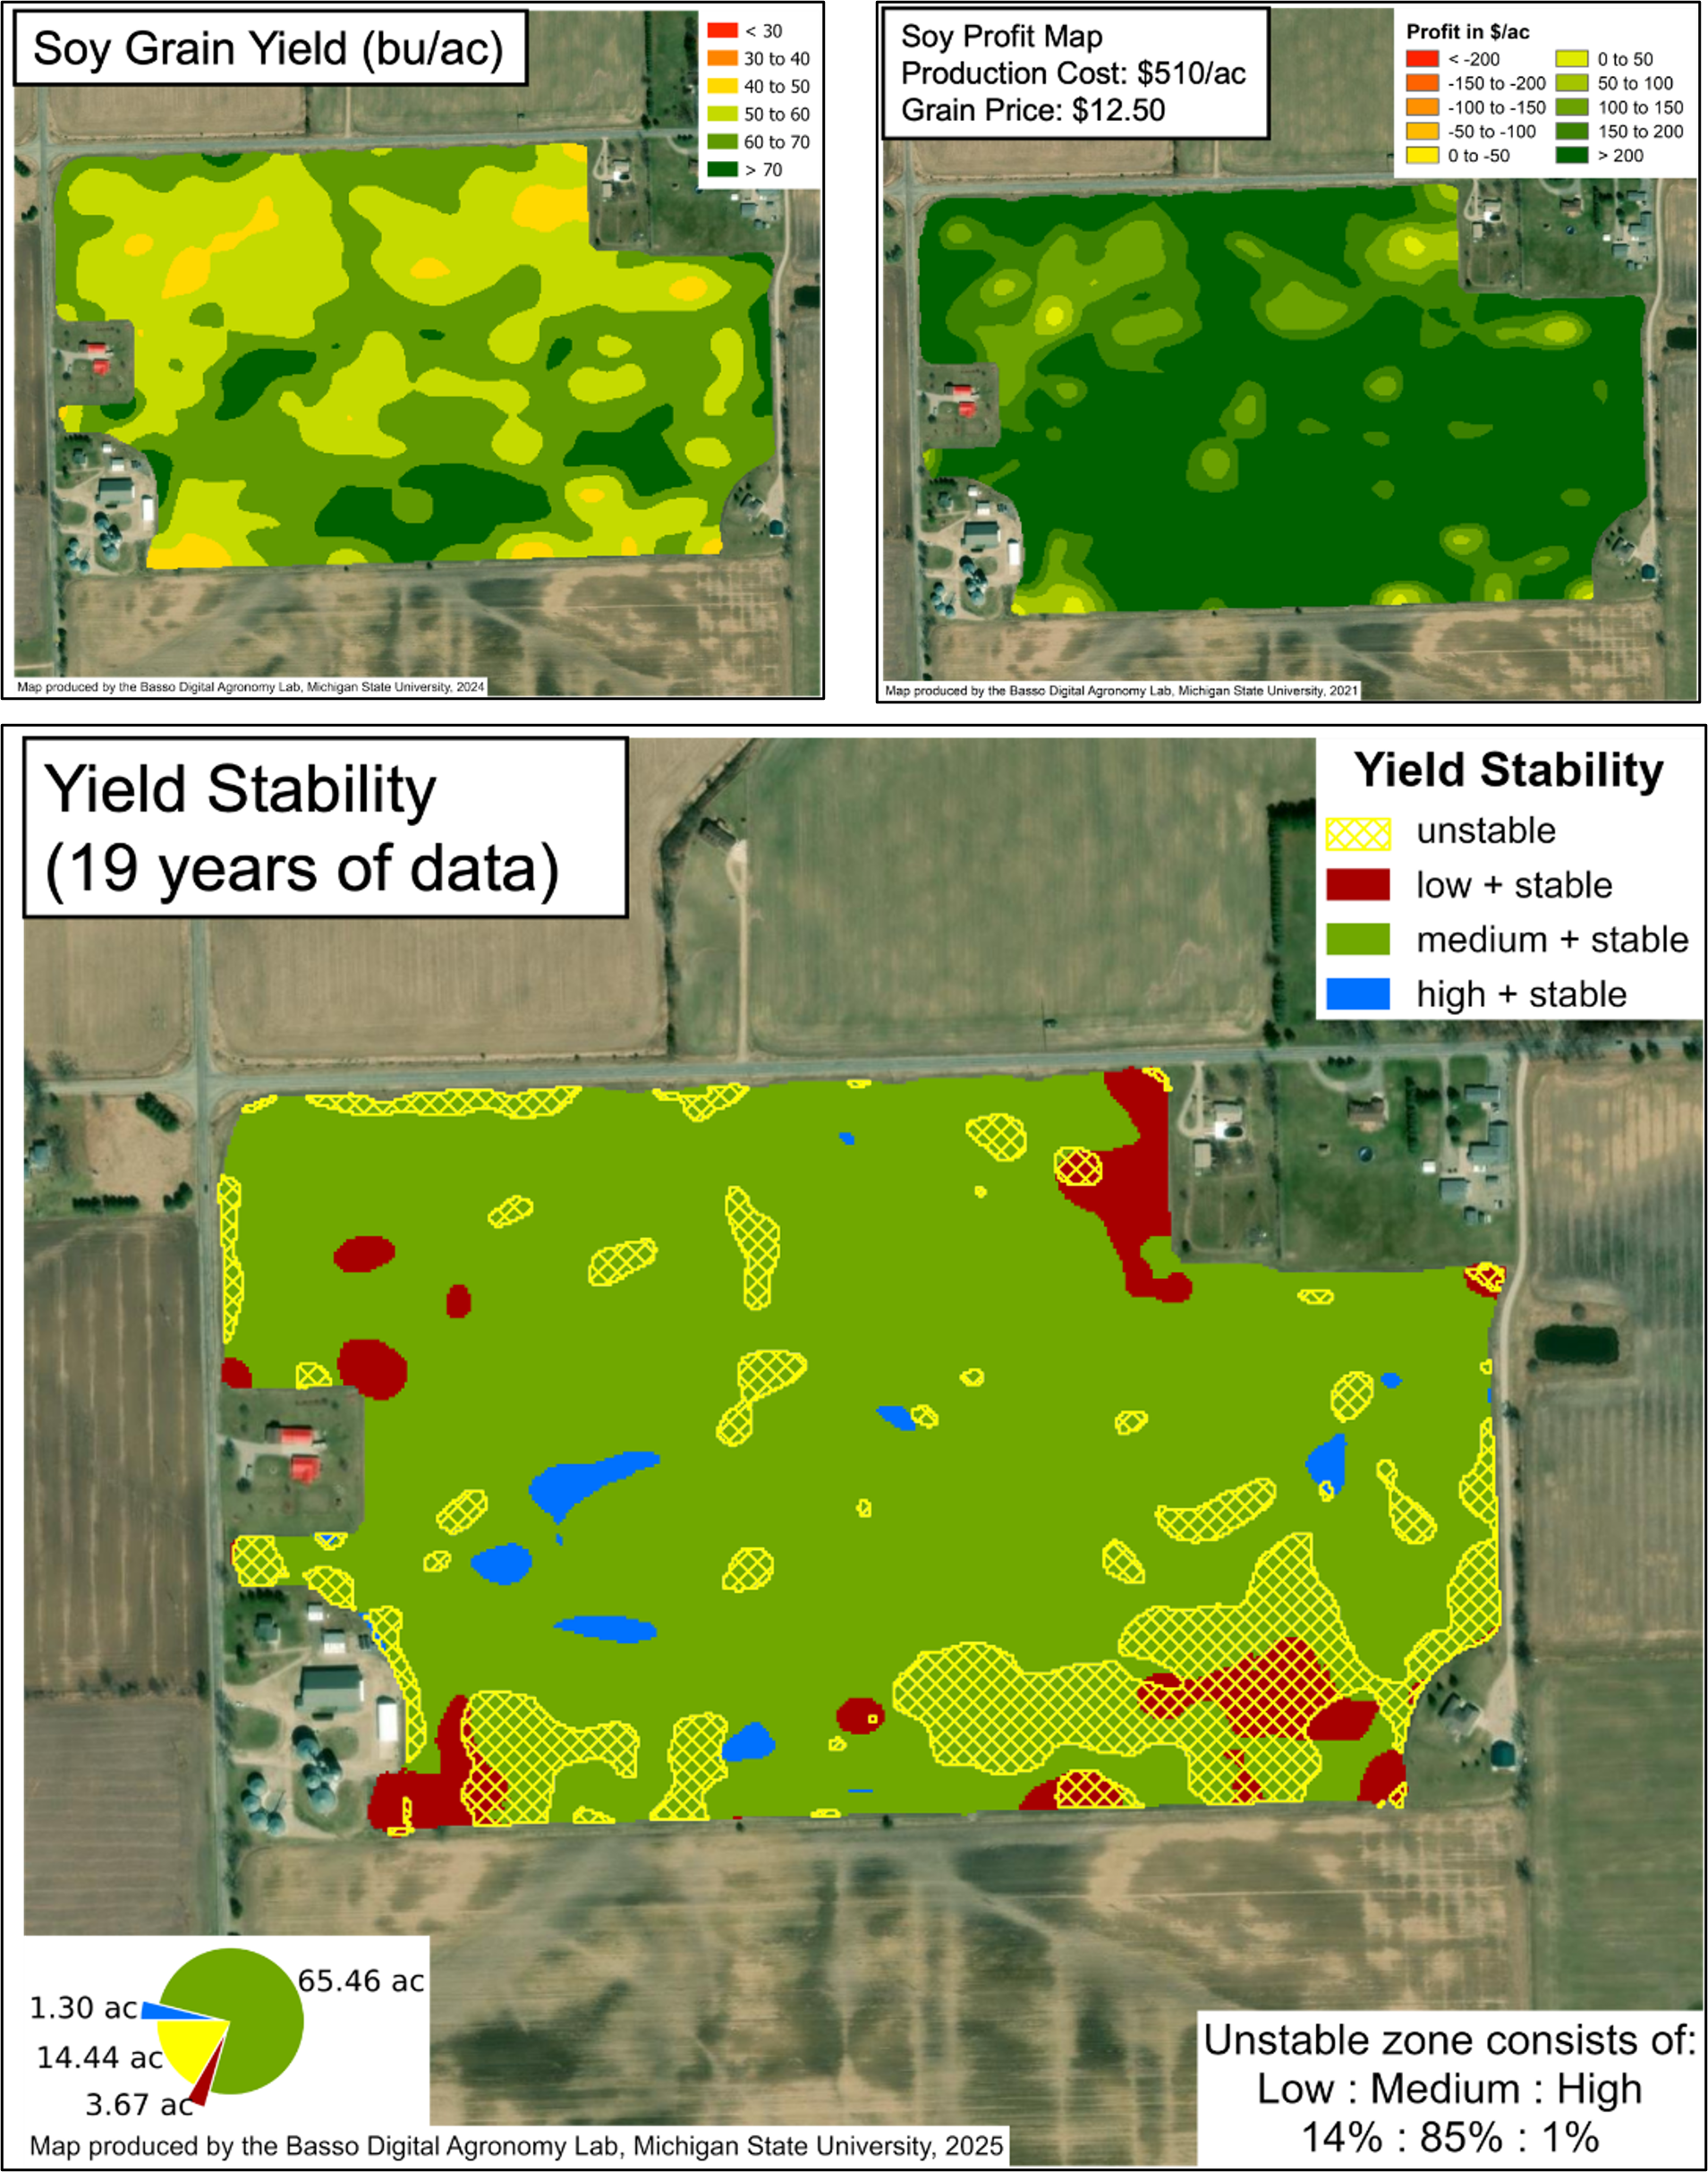
Another reason for creating quality yield maps is to track profitability over time across a crop rotation. Collecting accurate yield data from the combine is essential because it provides a detailed view of crop productivity, highlighting areas of high, medium, and low yield over time (Figure 1). Using these data, we can calculate net profitability by subtracting production costs from the revenue (yield multiplied by grain price). The result is a profitability map that shows where we’re making or losing money in the field. Creating zones based on these yields can help farmers make management decisions with land use to determine ways to improve their profitability of entire fields.
Yield data is a critical input for generating these tools, so it is important to make sure the data are accurate and precise. You have likely heard the phrase “garbage in, garbage out” applied to crop harvest data quality and the ability to make management decisions based on yield maps, so here are several steps you can take to prepare to collect quality yield data.
Before harvest season
- Scout fields in-season to look for patterns or areas of concern, e.g., ponding/saturation, wildlife damage, sandy/dry ridges, intense insect/disease pressure.
- Consider capturing aerial imagery to overlay onto yield map, or create .shp files using GIS software.
- Use this information to decide what areas to remove from data analysis when performing comparative trials, e.g., varieties, fertilizer or pest management products.
- Back up all precision data collected in past years in separate folders for each year and clear old data from the yield monitor to make data download faster at the end of the season.
- Ensure all farm employees have basic training on how to use monitors and that all monitors are feeding properly into your data management platform, if applicable, especially if more than one combine will be used in a given field.
- Inspect combine and grain handling equipment, repair areas where leaks may occur.
- Make sure monitor firmware is up to date.
During harvest season
The most important part of preparing for data collection is calibrating the yield monitor. Perform calibrations for each crop type at the beginning of the season and if crop conditions (e.g., moisture level, test weight) change significantly from one field to the next. Calibrations should include: 1) mass flow sensor, 2) moisture sensor, 3) lag time setting, 4) header position setting, 5) distance traveled measurement and 6) header cut width setting. Specific instructions for performing these steps will be found in the operator’s manual of your combine. The goal is for yield monitor readings to match actual load weights to within 1-2%.
In addition to the owner’s manual, two key resources for calibrating combines are the Michigan State University Extension article, “Yield monitor calibration procedure” by Dennis Pennington, and the Ohio State University Extension’s ANR-8 fact sheet, “Tips for Calibrating Grain Yield Monitors—Maximizing Value of Your Yield Data.” The Ohio State University Extension Harvest Technologies website also includes quick guides for several popular yield monitor brands and models, but I have found YouTube to be helpful as well.
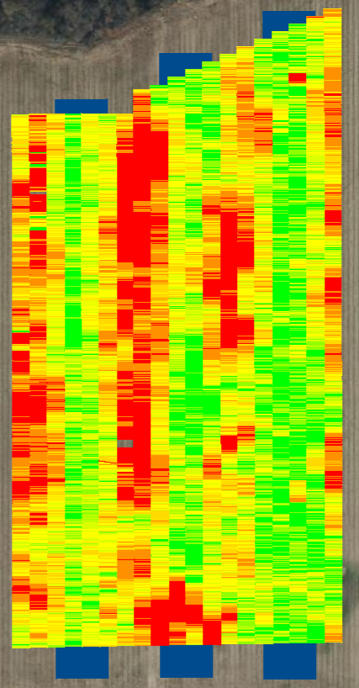
Most yield monitors allow for multiple loads per calibration, which is important because a monitor may be accurate at “the average” yield level but may over- or under-estimate yield in areas of the field with higher or lower yields than the average. Performing a two-point calibration (e.g., high and low speed, or full and partial header width) will not likely be sufficient since mass flow sensor response is typically not linear. Newer yield monitors with continuous calibration such as John Deere’s ActiveYield or Precision Planting’s YieldSense can produce quality yield maps with much less time and effort in calibrating. However, it is not recommended to use the auto-calibration system when pass-to-pass accuracy is needed such as when harvesting research plots or test strips as it can lead to inaccurate yield data (Figure 2).
Here are a few more things to consider as you progress through harvest season:
- Verify GPS offsets and other machine settings like header width, number of rows, and header mount points in the yield monitor for accurate geo-referencing of data.
- Make sure the monitor recognizes all connected modules at the beginning of each field.
- Monitor header loss at the beginning of each field or if crop conditions change and adjust minimize losses.
- Confirm the combine is reading to within 1-2% of actual load weights at least every few days and “true up” the monitor as needed.
Making future management decisions relies heavily on collecting precise and accurate yield data. You can’t always plan for the unexpected, but following the above guidelines and best practices can help get you set up for successful data collection this harvest season.
This article was produced by a partnership between Michigan State University Extension and the Michigan Soybean Committee. The article was first published in the Michigan Soybean News magazine.