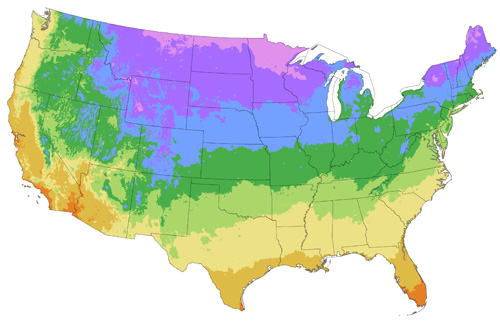
USDA releases new hardiness zone map
New United States Department of Agriculture hardiness map features more up-to-date climate data and interactivity. Here are the strengths and limitations of the latest update since 1990.
The United States Department of Agriculture has released a new plant hardiness zone map for the United States. The hardiness zone map divides the country into 13 hardiness zones based on average annual minimum winter temperatures, with zone 1 representing the coldest zone (-60 to -50°F) and zone 13 representing the warmest (60 to 70°F). Each zone is further divided into an “a” and “b” zone. The hardiness zones provide baseline information for gardener and landscapers looking to choose landscape plants for their location.
The new map replaces the earlier USDA hardiness zone map that was released in 1990. There are several features of the new map that are improvements on the old map. First, the new map integrates more complete and up-to-date climatic data so it offers a better representation of current climate conditions. In some cases, locations may be rated up to two zones warmer than the old map. Secondly, the new map offers much greater resolution and includes several user-friendly features such as a “zone-finder,” which identifies hardiness zones by zip codes and interactive maps.
In using hardiness zone information, it is important to recognize several limitations. First, since the maps are based on average annual minimum temperatures, there may be winters in which temperatures colder than the zone designation will occur. Second, zones may reflect micro-site effects that don’t pertain to a particular area. For example, suburbs around large cities like Chicago may be designated warmer than they actually are due to urban heat island effects associated with the core downtown area. Lastly, hardiness zones reflect plant cold tolerance needed to survive the average coldest temperature, but cannot account for fluctuating winter temperatures that may cause dehardening and subsequent injury.
These shortcomings notwithstanding, the new map is a welcomed addition and will provide useful baseline data for landscape plant selection.
New USDA plant hardiness zone map for the low 48 states.
Dr. Cregg's work is funded in part by MSU's AgBioResearch.


 Print
Print Email
Email
