Wheat watchers 2025 harvest report
 Print
Print Email
EmailWrap up of the 2025 wheat growing season in Michigan.
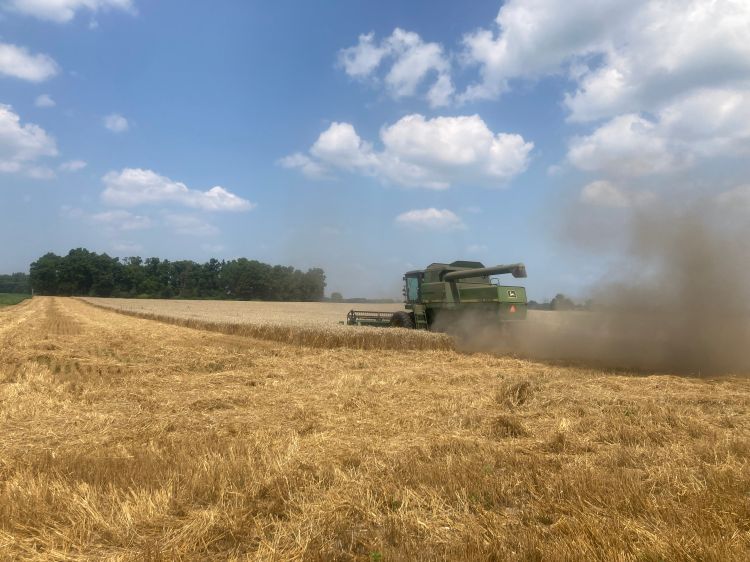
Wheat harvest has completed across Michigan! This is the harvest report for the state from those who chose to participate. Thank you to all of our wheat watchers this year who helped make these reports possible throughout the season.
Southwest Michigan
We had no wheat watchers reporting from the southwest region.
Southeast Michigan
We had one wheat watcher reporting from Monroe County near Ida who grows soft red winter wheat. The watcher averaged 110 bushel per acre and had test weights 58.5-60. Overall, they were happy with their crop.
East central (Thumb) Michigan
We had one wheat watcher reporting from Huron County near Elkton. They reported an average of 108 bushels per acre and that sandy soils were exceptionally low yielding. Falling numbers were 275-660 and average test weight was 59-61. While the crop had such a great start, the heat during final grain fill really hurt the yield.
Central Michigan
We had one watcher reporting from Gratiot County near Middleton. They have about 95% red and 5% white wheat in the area. Yields were 75-140 bushels per acre, with an average of 100 bushels per acre across the area. The red wheat in the area had falling numbers of 350-385 for most the harvest. The white wheat held up in the mid-300s until the area got rained on for the third time during harvest, but even then, only a few loads came in around 200. Test weights were exceptional to start harvest, ranging from 60-62. As they got into the third week of harvest, the top end fell off and the test weights changed to 55-59. Overall, 2025 wheat harvest was exceptional in the area with quality and yields being outstanding.
West central Michigan
We had one wheat watcher reporting from Kent County. Most growers across the area were over 90 bushels per acre and the test weights varied from 52-62. The falling numbers in red wheat were all above 300, with white wheat anywhere from 130 to above 300. In this area, the head scab spray definitely paid off.
North Michigan
We had no wheat watchers reporting from the northern region.
Season wrap up from Dennis Pennington
Wheat planting was generally on time for most parts of Michigan in the fall of 2024. Soybeans and dry beans matured in time to allow for timely planting of winter wheat. Much of the wheat growing regions of the state were dry to very dry at planting, leading some farms to plant later than desired due to lack of soil moisture. Other farms planted into dry conditions. Where soil moisture was adequate for germination and emergence, wheat tillered out well and looked good going into dormancy. Most of the state had enough moisture by mid-October for germination and overall, the crop looked good, but some fields were not tillered as much as others
Overwintering conditions were favorable in most parts of the state. There were several arctic air systems that brought very cold temperatures throughout the winter. Wheat still survived quite well mostly due to snow cover during the cold snaps. An early snow storm blanketed wheat in as much as a foot of snow while soil temperatures were still warm. This caused snow molds to grow in many fields, with some experiencing enough damage that the crop was destroyed. Spring warm up seemed slow, causing wheat growth to begin slow, putting it much further behind last year in terms of growth stages. This allowed more time for tillering in the spring for those fields that delayed planted or delayed emergence due to dry soil conditions. Spring and early summer warmed slowly with below normal growing degree day accumulation up to about Feekes 9. Cool conditions with high humidity provided the right conditions for powdery mildew to form and thrive. Many fields were treated with T1 fungicide as a result.
Little or no stripe rust was found this year. Disease pressure was light until flowering (Feekes 10.5.1). As the grain fill period started, it became apparent that there was high yield potential. Many fields had some lodging (nitrogen application overlap areas) while others had significant lodging. A severe thunderstorm with high winds occurred about halfway through the grain fill period that caused severe lodging in high yielding fields and those that did not receive a plant growth regulator application. Fields that were treated with plant growth regulators still experienced some lodging.
Some fields in the region saw high levels of cereal leaf beetle populations and feeding requiring control. High levels of beneficial insects were being found in fields across the region. Despite reports of armyworm larvae in some fields, populations and feeding remained low overall.
At harvest, crop quality was initially high with no reports of fusarium head blight. However, frequent rain led to some preharvest sprout issues. Crops harvested after multiple rains saw falling numbers drop below 225 in certain areas. In west central Michigan, stinking smut (common bunt) was reported and can result in load rejection. Test weights varied, and harvest started closer to normal rather than early like last year.
Temperatures were warmer at all locations compared to 2024. Generally, the highest temperatures occurred near the end of the grain fill period. While the high temperatures reduced yield potential, it could have been worse if the high temperatures occurred earlier in the grain fill period. Of the three locations listed in Table 1, Pigeon was the driest in April, May and July. However, Pigeon recorded 7.1 inches of rain for June. At Richville and Mason, rainfall was fairly well distributed over the four months.
Table 1. Number of days above 90 degrees Fahrenheit, 85 F and rainfall data from Michigan Automated Weather Station Network for three of the MSU Wheat Variety Trial Locations for the 2023, 2024 and 2025 growing seasons. 2025 data was reported through July 20, 2025.
|
|
2023 |
2024 |
2025 |
||||||
|
|
Pigeon |
Richville |
Mason |
Pigeon |
Richville |
Mason |
Pigeon |
Richville |
Mason |
|
Above 90 F |
8 |
4 |
8 |
3 |
1 |
2 |
6 |
4 |
6 |
|
Above 85 F |
16 |
15 |
21 |
10 |
9 |
14 |
16 |
15 |
20 |
|
April (in) |
3.4 |
3.1 |
3.7 |
2.2 |
2.8 |
2.5 |
1.1 |
3.7 |
3.0 |
|
May (in) |
1.6 |
1.0 |
1.3 |
2.8 |
4.1 |
2.8 |
1.7 |
4.5 |
3.9 |
|
June (in) |
1.6 |
1.5 |
0.8 |
2.2 |
3.9 |
3.9 |
7.1 |
3.9 |
3.6 |
|
July (in) |
4.1 |
3.5 |
1.9 |
3.5 |
3.2 |
4.7 |
1.0 |
1.9 |
1.4 |