White mold severity in Michigan’s Thumb by variety
 Print
Print Email
EmailHow did varieties stack up in their performance against white mold in 2014?
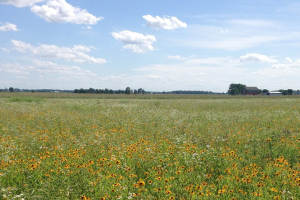
Cool, wet weather and morning fog in July and August 2014 made for ideal conditions for white mold development on soybeans across Michigan. Three of four Michigan State University Extension Thumb Ag Research and Education (TARE) soybean field trials were infected to the extent that comparisons could be made between varieties. Ratings were taken at trial sites in Elkton, Michigan, planted May 30; Fairgrove, Michigan, planted June 1; and Sandusky, Michigan, planted June 4.
The MSU Extension TARE plots include variety trials planted in three maturity groups: Group 1.9 and less (20 varieties), Group 2.0-2.2 (25 varieties), and Group 2.3+ (29 varieties). Trials in Fairgrove, Michigan and Sandusky, Michigan were replicated four times, and trials at Elkton, Michigan were replicated three times. Plots were 75 feet long and 15 feet wide and were planted in six 30-inch rows.
Varieties were scored for white mold severity on a 0-3 scale, where 0 = no infection, 1 = infection only on branches, 2 = infection on the main stem but pod fill was normal, and 3 = infection on the main stem resulting in plant death and poor pod fill. Three plants were inspected in 20 random spots in the center of each plot. The 20 scores were totaled and divided by 60 (the total if all 20 scores were given a rating of 3) and multiplied by 100 to give a disease severity index (DSI). A DSI of 100 would be given to a plot where all evaluated plants had a rating of 3. A DSI of 0 would be given to a plot where all evaluated plants had a rating of 0.
The planted population at the Elkton site was 160,000 seeds per acre. The planted population at the Fairgrove and Sandusky sites were 140,000 seeds per acre. The stand counts were 118,900; 128,950; and 122,630 respectively at the Elkton, Fairgrove and Sandusky sites.
Plots were rated during the second two weeks of September. Because of the wide range in maturity, plots ranged from growth stage R6 (full seed) to R8 (full maturity), with the majority in growth stage R7 (beginning maturity).
White mold pressure was variable between sites. Disease pressure was greatest at the Fairgrove site (moderate-heavy), followed by Elkton (moderate) and Sandusky (moderate-light). Disease pressure also tended to be variable within sites. For example, the northern end of the Sandusky plot (replications 3 and 4 of the Groups 1.9 and less and 2.0-2.3 studies) had virtually no white mold pressure. Hence, those two replications were not included in the DSI ratings. Finally, the late maturing varieties tended to be more severely infected than varieties within the medium and early studies, presumably due to the varieties flowering during peak stages of pathogen activity (i.e., spore release). The table below list the severity index for varieties within the early, medium and late maturity groups, respectively.
2014 White mold severity - MSU Extension TARE Soybean Variety Group 1.9 and less
|
Variety |
Location |
|||
|
Elkton |
Fairgrove |
Sandusky |
Average |
|
|
Hyland Seeds HS 14RYS44 |
15.6 |
32.5 |
4.2 |
17.4 |
|
Mycogen 5B130R2 |
18.3 |
27.9 |
15.0 |
20.4 |
|
Stine Seed Company 14RD62 |
20.6 |
30.4 |
20.7 |
23.9 |
|
Hyland Seeds HS 15RYS45 |
35.0 |
25.0 |
17.5 |
25.8 |
|
NuTech Seed, LLC 7157 G2 Genetics |
20.6 |
46.7 |
15.8 |
27.7 |
|
Great Lakes Hybrids 1441 R2 |
16.1 |
40.8 |
27.5 |
28.1 |
|
Croplan R2C1873 |
33.9 |
23.8 |
31.6 |
29.7 |
|
Great Lakes Hybrids 1689 R2 |
25.6 |
45.0 |
20.8 |
30.5 |
|
DF Seeds, Inc DF 51931 N R2Y |
35.6 |
38.8 |
17.6 |
30.6 |
|
Croplan R2C1994 |
33.3 |
31.7 |
27.5 |
30.8 |
|
Rupp Seeds, Inc rs7184 |
30.6 |
29.6 |
36.7 |
32.3 |
|
Dairyland Seed Co DSR-1515R2Y |
30.6 |
34.6 |
36.7 |
33.9 |
|
Dyna-Gro 34RY17 |
26.1 |
27.9 |
49.2 |
34.4 |
|
Hyland Seeds HS 18RY09 |
33.3 |
39.6 |
32.5 |
35.1 |
|
Syngenta Seeds NK Brand S19-Z9 |
38.9 |
26.7 |
40.8 |
35.5 |
|
Asgrow AG1835 |
40.6 |
43.3 |
24.2 |
36.0 |
|
Asgrow AG1832 |
33.3 |
45.8 |
31.7 |
36.9 |
|
Hyland Seeds HS 18RYS13 |
33.9 |
42.9 |
36.7 |
37.8 |
|
Great Lakes Hybrids 1829 R2 |
38.9 |
55.0 |
29.2 |
41.0 |
|
Asgrow AG1935 |
42.8 |
55.4 |
32.5 |
43.6 |
|
Average |
30.2 |
37.2 |
27.4 |
31.6 |
2014 White mold severity – MSU Extension TARE Soybean Variety Group 2.0-2.2
|
Variety |
Location |
|||
|
Elkton |
Fairgrove |
Sandusky |
Average |
|
|
NuTech Seed, LLC 7216 G2 Genetics |
38.3 |
40.8 |
5.0 |
28.1 |
|
Channel 2105R2 |
34.4 |
42.1 |
9.7 |
28.7 |
|
Croplan R2C2072 |
41.1 |
52.5 |
5.0 |
32.9 |
|
Channel 2108 |
47.2 |
42.1 |
20.2 |
36.5 |
|
NuTech Seed, LLC 7204 G2 Genetics |
53.9 |
47.9 |
10.0 |
37.3 |
|
DF Seeds, Inc DF 5213 N R2Y |
50.0 |
50.4 |
14.2 |
38.2 |
|
Great Lakes Hybrids 2039 R2 |
52.2 |
52.1 |
12.5 |
38.9 |
|
Stine Seed Company 22RD00 |
52.2 |
39.6 |
26.2 |
39.3 |
|
Dyna-Gro S20RY94 |
52.8 |
50.0 |
15.8 |
39.5 |
|
Asgrow AG2035 |
37.2 |
65.0 |
16.7 |
39.6 |
|
Syngenta Seeds NK Brand S20-T6 |
50.0 |
41.3 |
31.7 |
41.0 |
|
Mycogen Seeds 5N223R2 |
54.4 |
48.8 |
20.5 |
41.2 |
|
Mycogen Seeds 5N206R2 |
46.7 |
58.8 |
18.3 |
41.3 |
|
Dyna-Gro S20RY45 |
52.8 |
51.3 |
20.8 |
41.6 |
|
Syngenta Seeds NK Brand S22-S1 |
54.4 |
51.7 |
20.8 |
42.3 |
|
Great Lakes Hybrids 2289 R2 |
47.8 |
56.7 |
24.2 |
42.9 |
|
Asgrow AG2232 |
38.9 |
64.2 |
25.8 |
43.0 |
|
Dyna-Gro S22RY64 |
51.1 |
59.2 |
19.2 |
43.1 |
|
Rupp Seeds, Inc rs7222 |
51.7 |
58.3 |
22.5 |
44.2 |
|
Asgrow AG2031 |
45.0 |
56.7 |
31.7 |
44.4 |
|
Dairyland Seed Co DSR-2105R2Y |
52.8 |
49.6 |
32.5 |
45.0 |
|
Hyland Seed HS 22RYS03 |
59.4 |
51.7 |
25.0 |
45.4 |
|
Stine Seed Company 20RD20 |
43.7 |
65.4 |
27.5 |
45.5 |
|
Great Lakes Hybrids 2019 R2 |
59.4 |
42.9 |
37.5 |
46.6 |
|
Croplan R2C2124 |
52.8 |
59.6 |
30.0 |
47.5 |
|
Average |
48.8 |
51.9 |
20.9 |
40.6 |
2014 White mold severity - MSU Extension TARE Soybean Variety Group 2.6 and more
|
Variety |
Location |
|||
|
Elkton |
Fairgrove |
Sandusky |
Average |
|
|
Beck's Superior Hybrids 278R4 |
36.1 |
58.8 |
24.2 |
39.7 |
|
NuTech Seed, LLC 7261 G2 Genetics |
24.4 |
63.8 |
40.8 |
43.0 |
|
Mycogen Seeds 2N263R2 |
35.6 |
69.2 |
25.4 |
43.4 |
|
Hyland Seeds HS 25RYS47 |
44.3 |
46.3 |
47.1 |
45.9 |
|
Dairyland Seed Co DSR-2612R2Y |
36.7 |
73.3 |
30.0 |
46.7 |
|
Beck's Superior Hybrids 241NR |
45.6 |
62.5 |
35.4 |
47.8 |
|
Beck's Superior Hybrids 229NR |
39.4 |
70.4 |
39.2 |
49.7 |
|
Channel 2306R2 |
55.6 |
62.9 |
32.1 |
50.2 |
|
NuTech Seed, LLC 7233 G2 Genetics |
53.9 |
56.7 |
41.7 |
50.7 |
|
Hyland Seeds HS 5A255RR2 |
34.4 |
64.2 |
54.2 |
50.9 |
|
Channel 2508 |
55.0 |
71.7 |
28.3 |
51.7 |
|
Great Lakes Hybrids 2469 R2 |
46.7 |
71.7 |
37.1 |
51.8 |
|
Stine 24RE03 |
50.0 |
55.4 |
51.3 |
52.2 |
|
Asgrow AG2632 |
39.4 |
68.3 |
49.6 |
52.5 |
|
Hyland Seeds HS 25RY05 |
51.1 |
69.2 |
38.3 |
52.9 |
|
Asgrow AG2433 |
37.2 |
80.0 |
41.7 |
53.0 |
|
NuTech Seed, LLC 7250 G2 Genetics |
57.2 |
67.9 |
38.3 |
54.5 |
|
NuTech Seed, LLC 7240 G2 Genetics |
55.0 |
65.0 |
44.2 |
54.7 |
|
Rupp Seeds, Inc rs7251 |
52.2 |
75.0 |
37.9 |
55.0 |
|
Dyna-Gro S25RY44 |
45.0 |
75.4 |
47.5 |
56.0 |
|
Dyna-Gro S24RY65 |
60.6 |
57.5 |
52.1 |
56.7 |
|
Dyna-Gro S26RY75 |
59.4 |
71.7 |
43.8 |
58.3 |
|
Great Lakes Hybrids 2319 R2 |
54.4 |
68.8 |
52.5 |
58.6 |
|
Rupp Seeds, Inc rs7245 |
51.7 |
81.3 |
44.2 |
59.0 |
|
Croplan R2C2394 |
60.6 |
64.2 |
53.8 |
59.5 |
|
Rupp Seeds, Inc rs7262 |
57.8 |
72.1 |
50.0 |
60.0 |
|
DF Seeds, Inc DF 5244 N R2Y |
58.9 |
82.1 |
47.9 |
63.0 |
|
DF Seeds, Inc DF 5263 N R2Y |
58.3 |
74.6 |
61.7 |
64.9 |
|
Hyland Seeds HS 26RYS16 |
58.7 |
74.2 |
63.3 |
65.4 |
|
Average |
48.8 |
68.1 |
43.2 |
53.4 |
These results were not analyzed statistically. The results should be taken as a relative performance against white mold between varieties.
That being said, in the Group 1.9 and earlier varieties, the four varieties that appear at the top of the trial were generally less infected with white mold at each of the three sites, and the four varieties at the bottom of the table were generally more infected at each of the three sites. Likewise, the top three and the bottom three varieties in the 2.0-2.2 varieties were generally similar in infection levels at each of the three sites. Also, there is agreement in infection levels between the top four and bottom three varieties in the 2.3 and more trial.
Readers should not compare results between maturity groups. White mold infection levels varied between sites, and between studies at individual sites. The group 2.3 and more trial in Fairgrove was heavily infested, and the 1.9- and 2.0-2.2 studies at the Sandusky trial were lightly infested. So, a variety with an average DSI of 40 in the 1.9- group does not have the same level of white mold resistance as a variety with an average DSI of 40 in the group 2.3 and more trial.
The 2014 growing season is likely to stand out as one of the very worst years for white mold infections, and disease severity at these levels are unlikely to occur again for some time. Selecting varieties based on relative resistance to white mold is part of a strategy, including crop rotation, tillage choices, and use of fungicides in fields with a history of severe white mold. Growers are encouraged to seek out similar studies from other universities as well as industry data and compare results.