

Heads In, Hearts In: Photo-Graph
DOWNLOADMay 25, 2021 - MSU Extension
 Print
Print Email
EmailWhat you need to know:
A graph is a way to show numbers in a chart or picture. A bar graph is used to show information in lines using columns and rows. A column is vertical or upright, and information is shown stacked on top of each other. A row is horizontal, and information is displayed in a left-to-right fashion or side by side.
What you will do and learn:
This activity will help you practice counting and grouping items and then displaying or graphing your results. In this activity, you will identify shapes, count the number of matching pictures, and then use a bar graph to display the results.
Other Documents in this Series
You Might Also Be Interested In
-
Helping Create A Solid Foundation For Children
Published on August 6, 2024
-
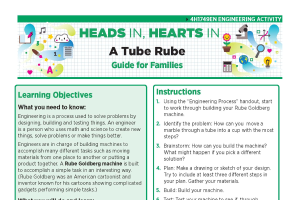
Heads In, Hearts In: A Tube Rube
Published on June 20, 2022
-
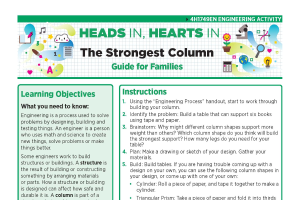
Heads In, Hearts In: The Strongest Column
Published on June 20, 2022
-
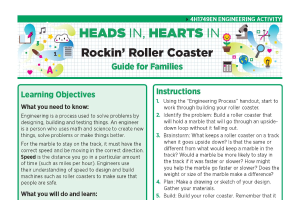
Heads In, Hearts In: Rockin’ Roller Coaster
Published on June 20, 2022
-
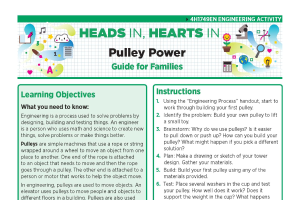
Heads In, Hearts In: Pulley Power
Published on June 20, 2022
-
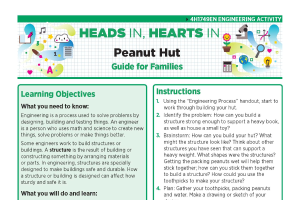
Heads In, Hearts In: Peanut Hut
Published on June 20, 2022

Accessibility Questions:
For questions about accessibility and/or if you need additional accommodations for a specific document, please send an email to ANR Communications & Marketing at anrcommunications@anr.msu.edu.