Michigan State University Michigan State University

Department of Forestry Forest Carbon and Climate Program

  • About
  • Graduate Certificate
  • Professional Courses
  • Projects + Research
  • Open Resource Library
  • News + Events
  • Home
  • Open Resource Library
  • Images + Graphics

Terminology

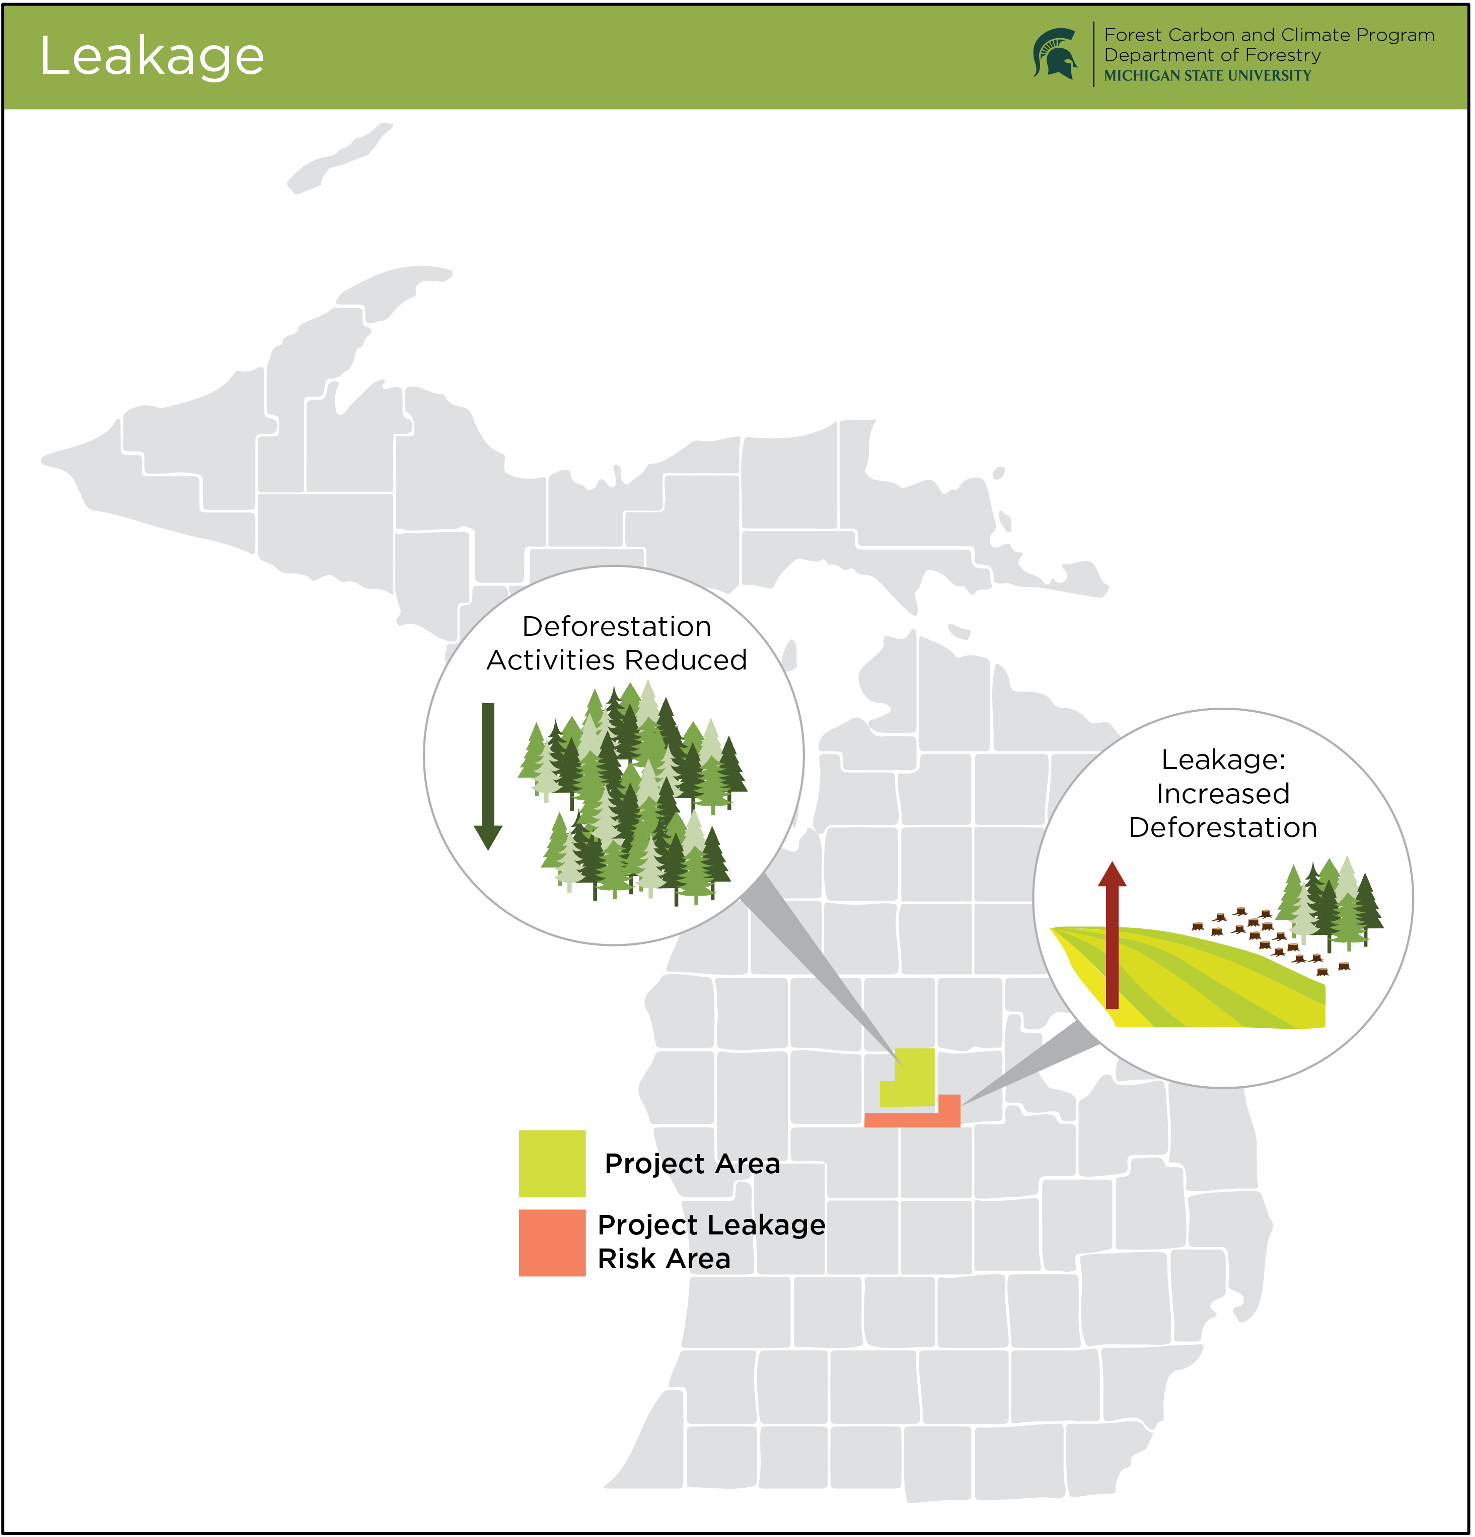
  • Project Leakage: Leakage refers to a measurable increase in GHG emissions outside the project boundary caused by activities being limited within the project boundary.

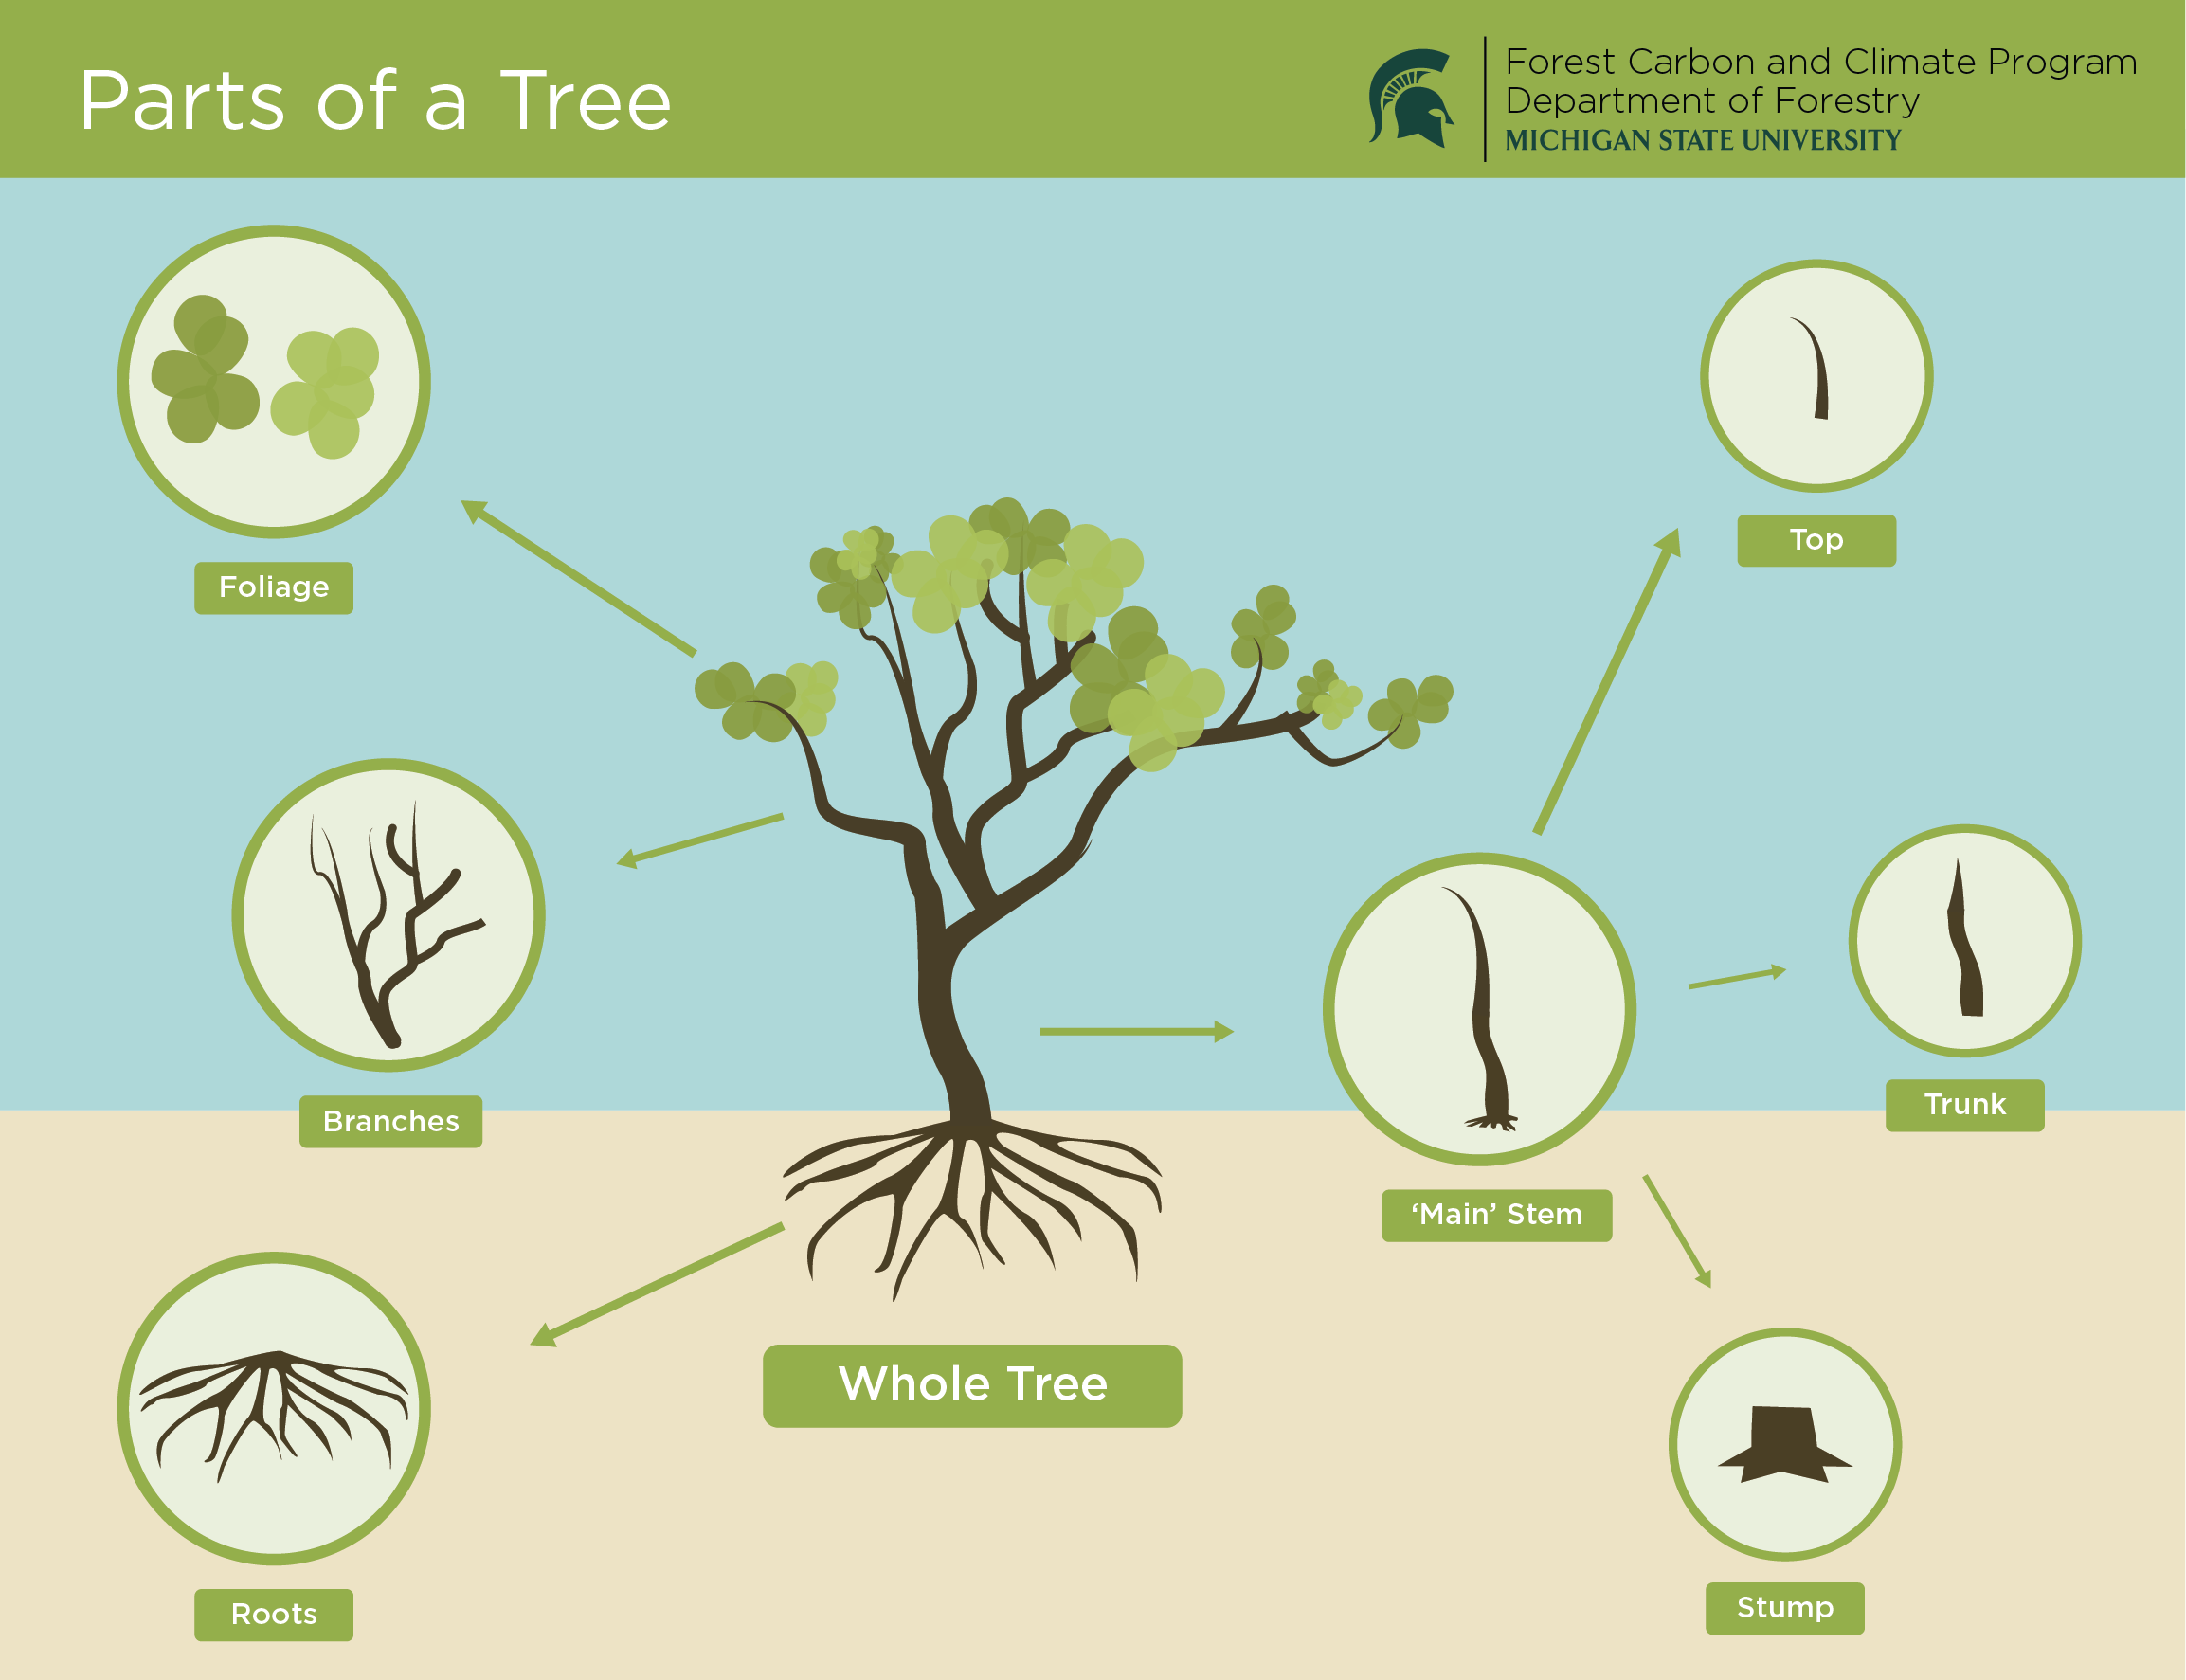
  • Parts of a Tree: An overview of the exterior structure of a deciduous tree.

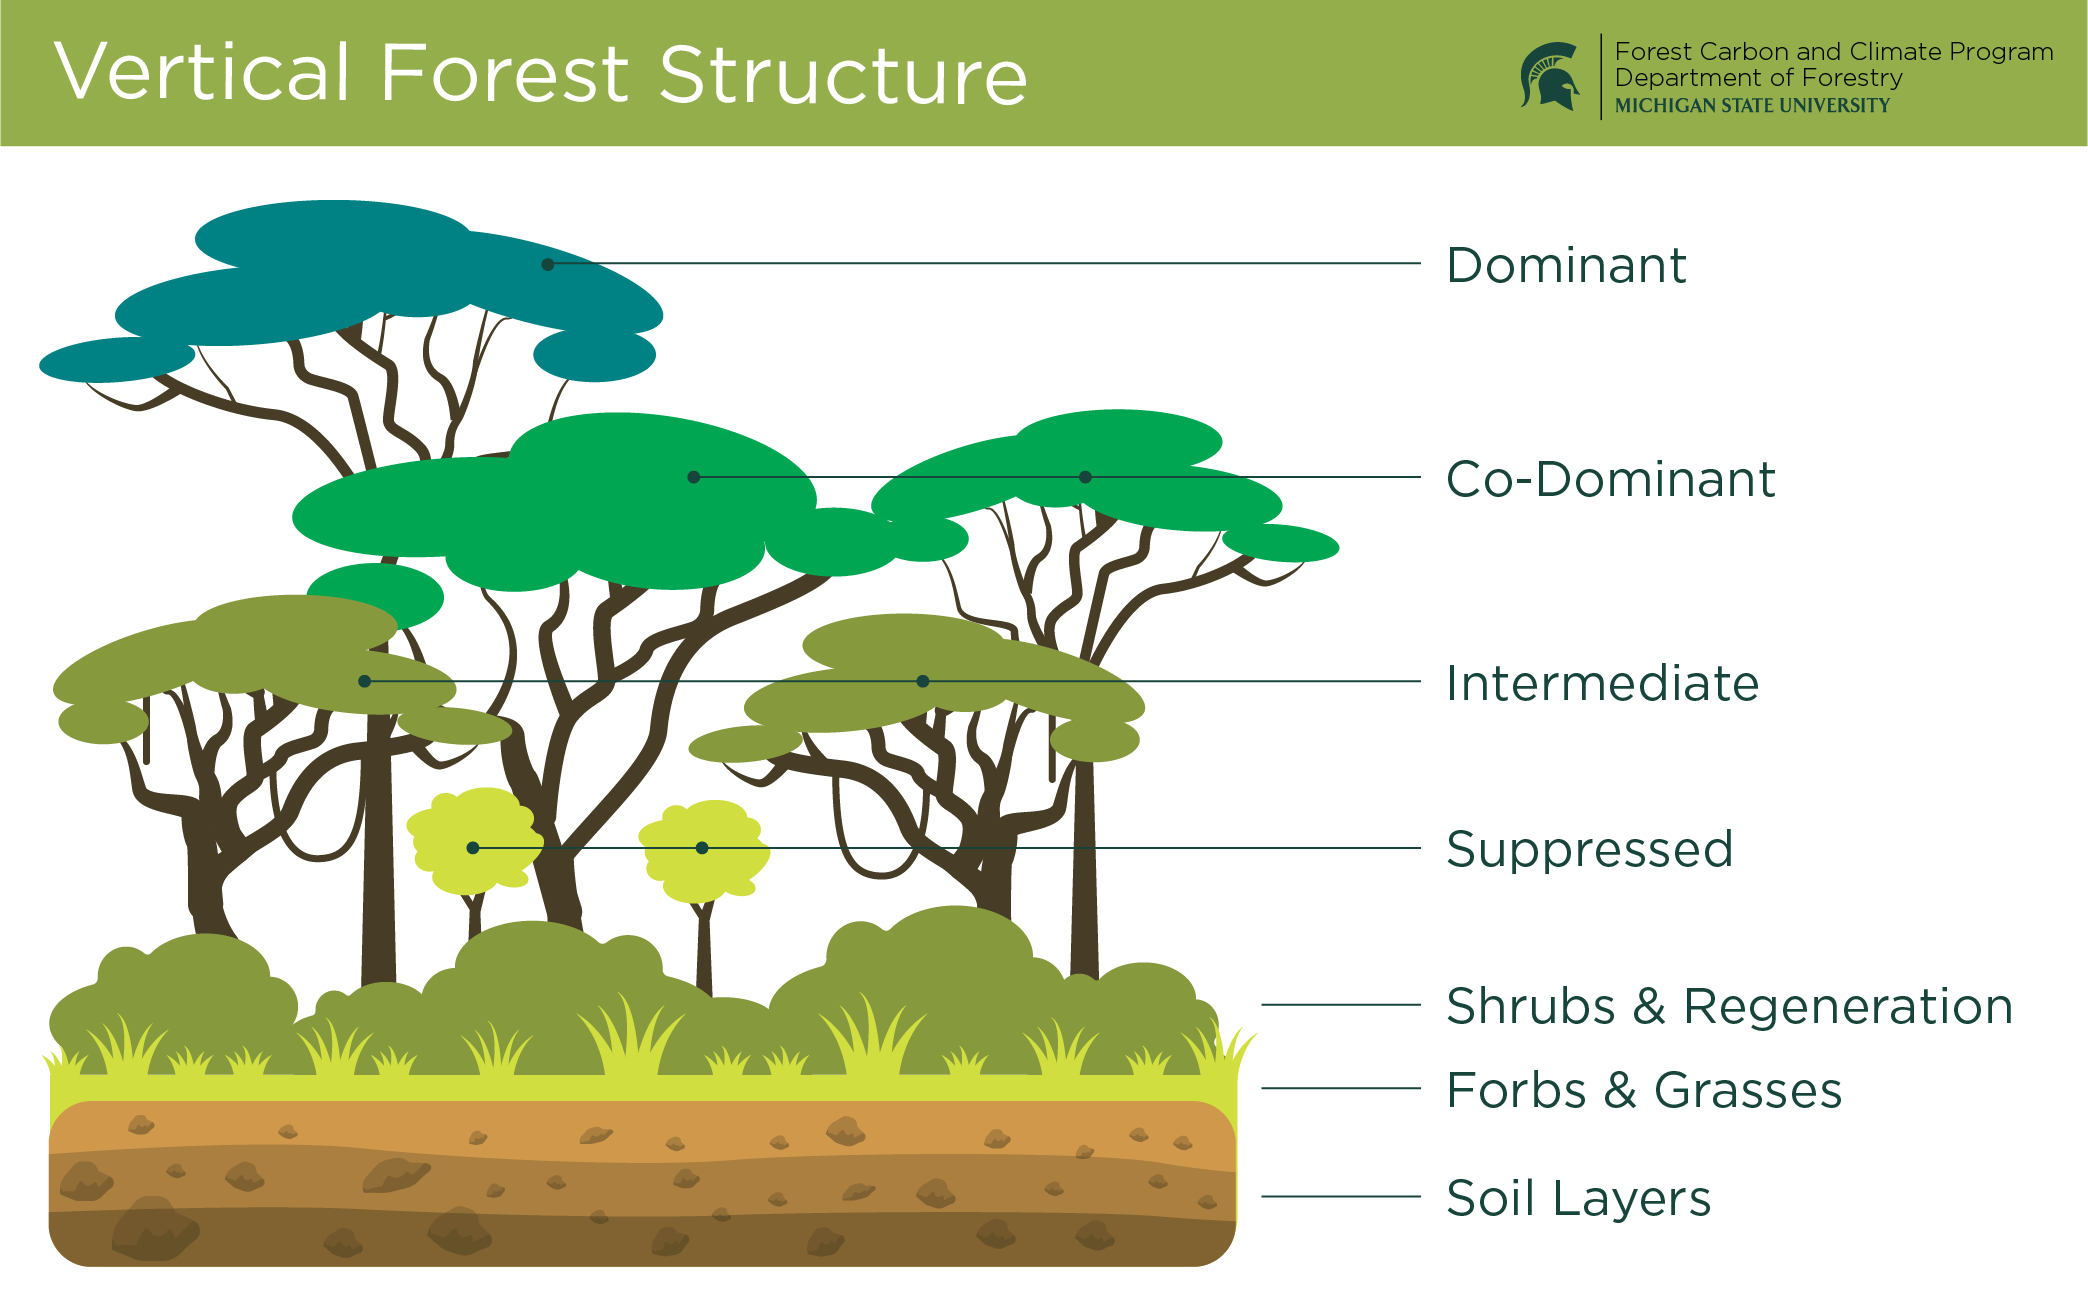
  • Vertical Forest Structure: An image highlighting the different levels and vertical structure of forests, from soil layers to dominant foliage.

Images & Graphics

  • Graphs, Charts, and Maps
  • Ecological Diagrams
  • Terminology
  • Policy & Markets
  • Spanish
  • US Regional Intensive Figures
  • Urban Forestry Figures
  • Wildland Fire and Forest Carbon Management Figures
  • follow us on youtube
  • follow us on twitter
  • follow us on flickr
  • follow us on facebook
  • follow us on instagram
  • follow us on linkedin
Michigan State University
  • Call Us: 517-353-1961
  • Contact Information
  • Sitemap
  • Accessibility
  • Privacy
  • Call MSU: (517) 355-1855
  • Visit: msu.edu
  • Notice of Nondiscrimination
  • Spartans Will.
  • © Michigan State University

Issued in furtherance of MSU Extension work, acts of May 8 and June 30, 1914, in cooperation with the U.S. Department of Agriculture. Quentin Tyler, Director, MSU Extension, East Lansing, MI 48824. This information is for educational purposes only. Reference to commercial products or trade names does not imply endorsement by MSU Extension or bias against those not mentioned.

The 4-H Name and Emblem have special protections from Congress, protected by code 18 USC 707.

We comply with the Federal Trade Commission 1998 Children’s Online Privacy Protection Act (COPPA).

Filter by content type
Michigan State University green logo graphic

Department of Forestry Forest Carbon and Climate Program

  • Home
  • Open Resource Library
  • Images + Graphics
  • Images & Graphics

  • Graphs, Charts, and Maps
  • Ecological Diagrams
  • Terminology
  • Policy & Markets
  • Spanish
  • US Regional Intensive Figures
  • Urban Forestry Figures
  • Wildland Fire and Forest Carbon Management Figures
  • share this on facebookShare
  • share this on twitterTweet
  • save to PinterestSave
  • share this on linkedinShare
  • print this pagePrint
  • Email this pageEmail