


US Regional Intensive Figures
-
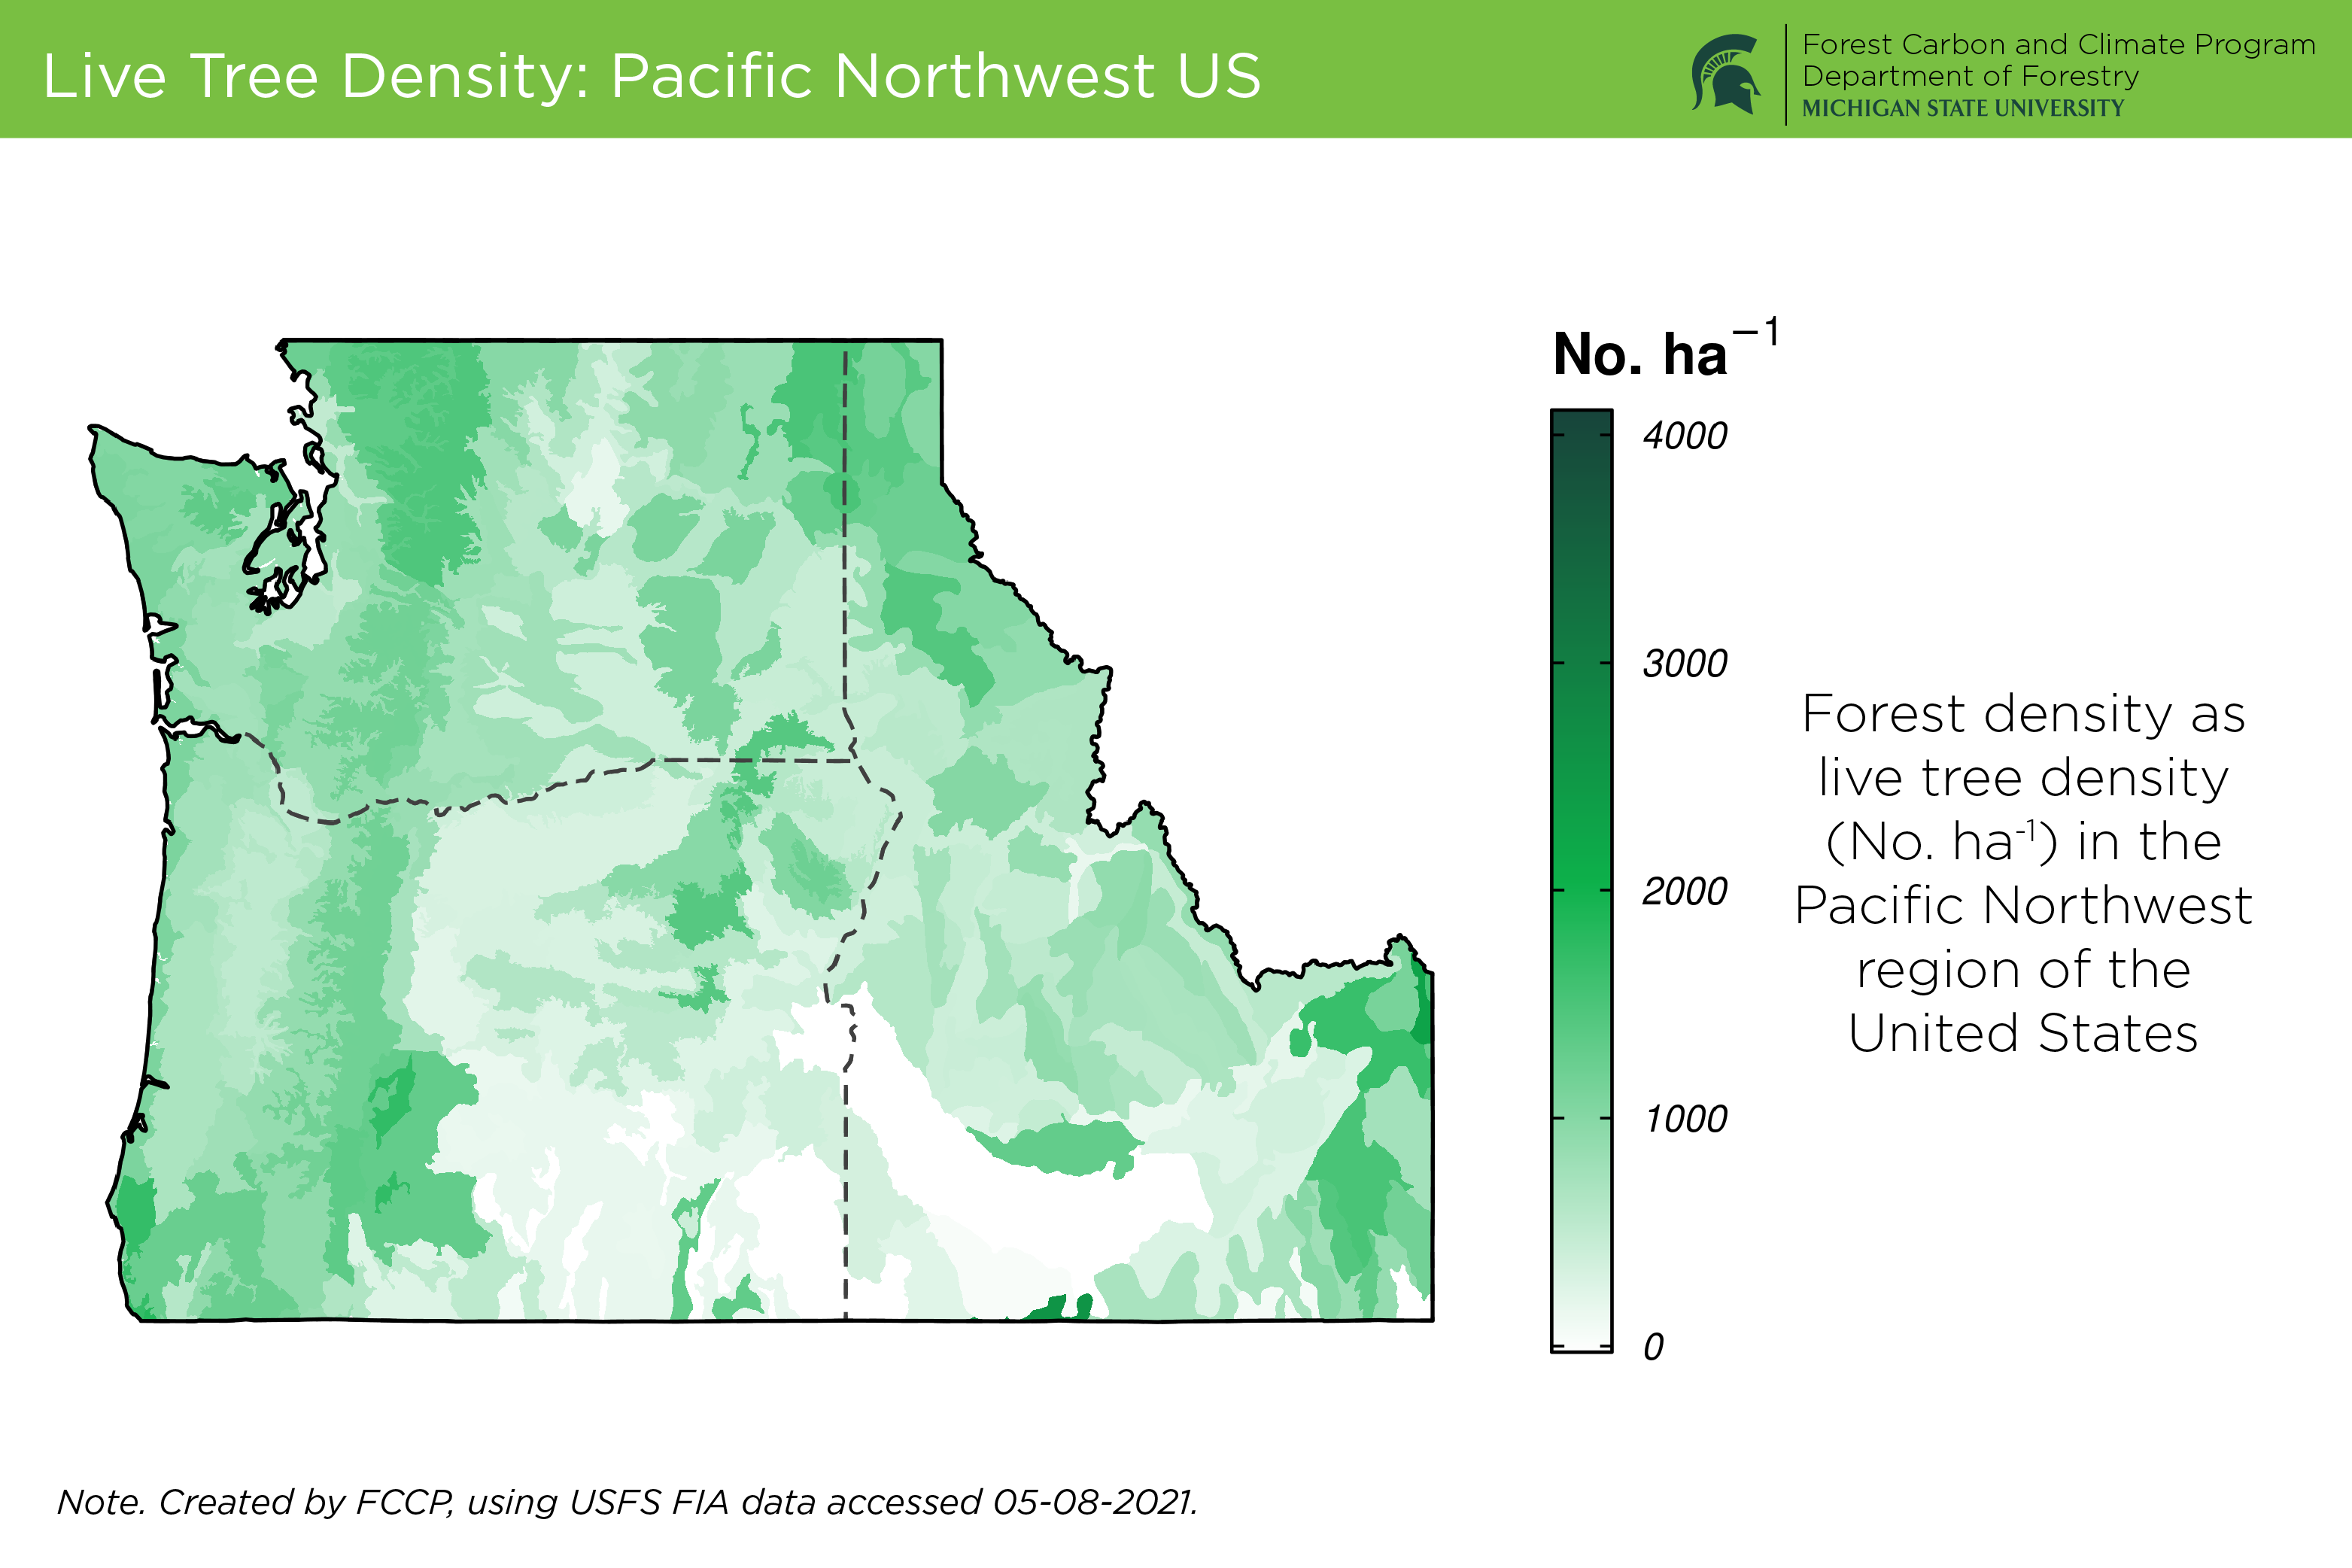
Live Tree Density: Pacific Northwest US
-
Total Forest Area by Forest Type: Pacific Northwest US
-
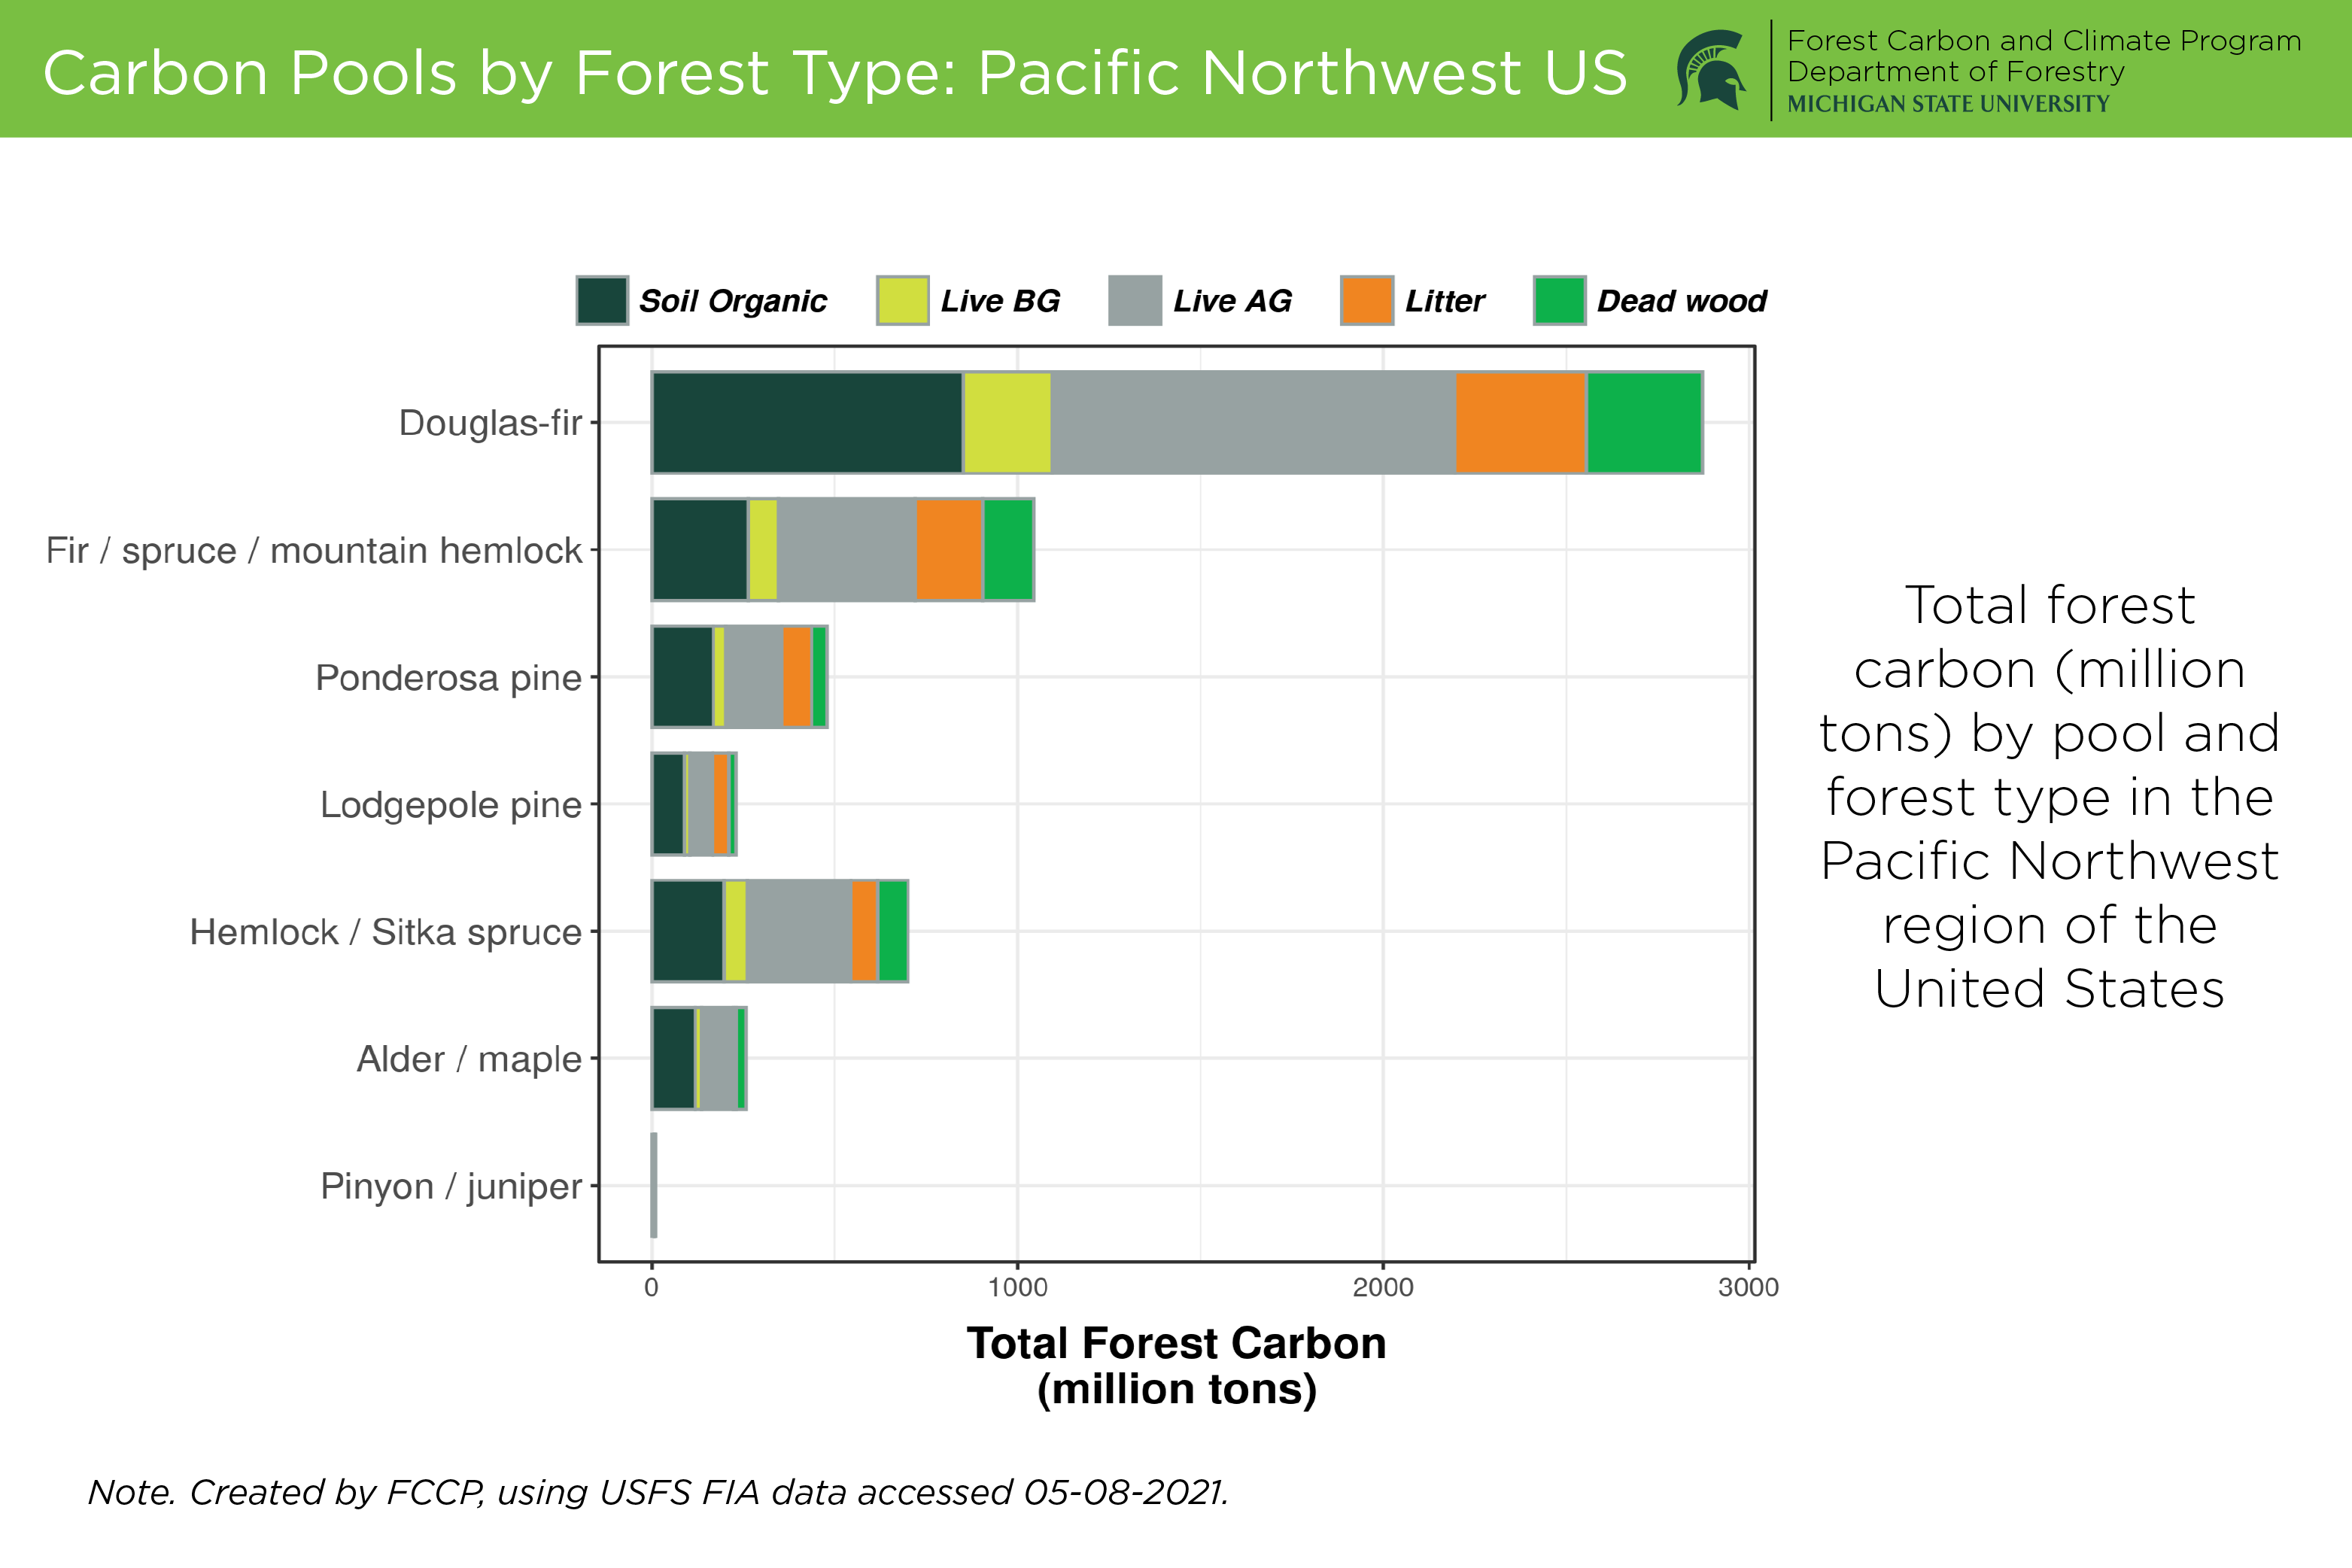
Carbon Pools by Forest Type: Pacific Northwest US
-
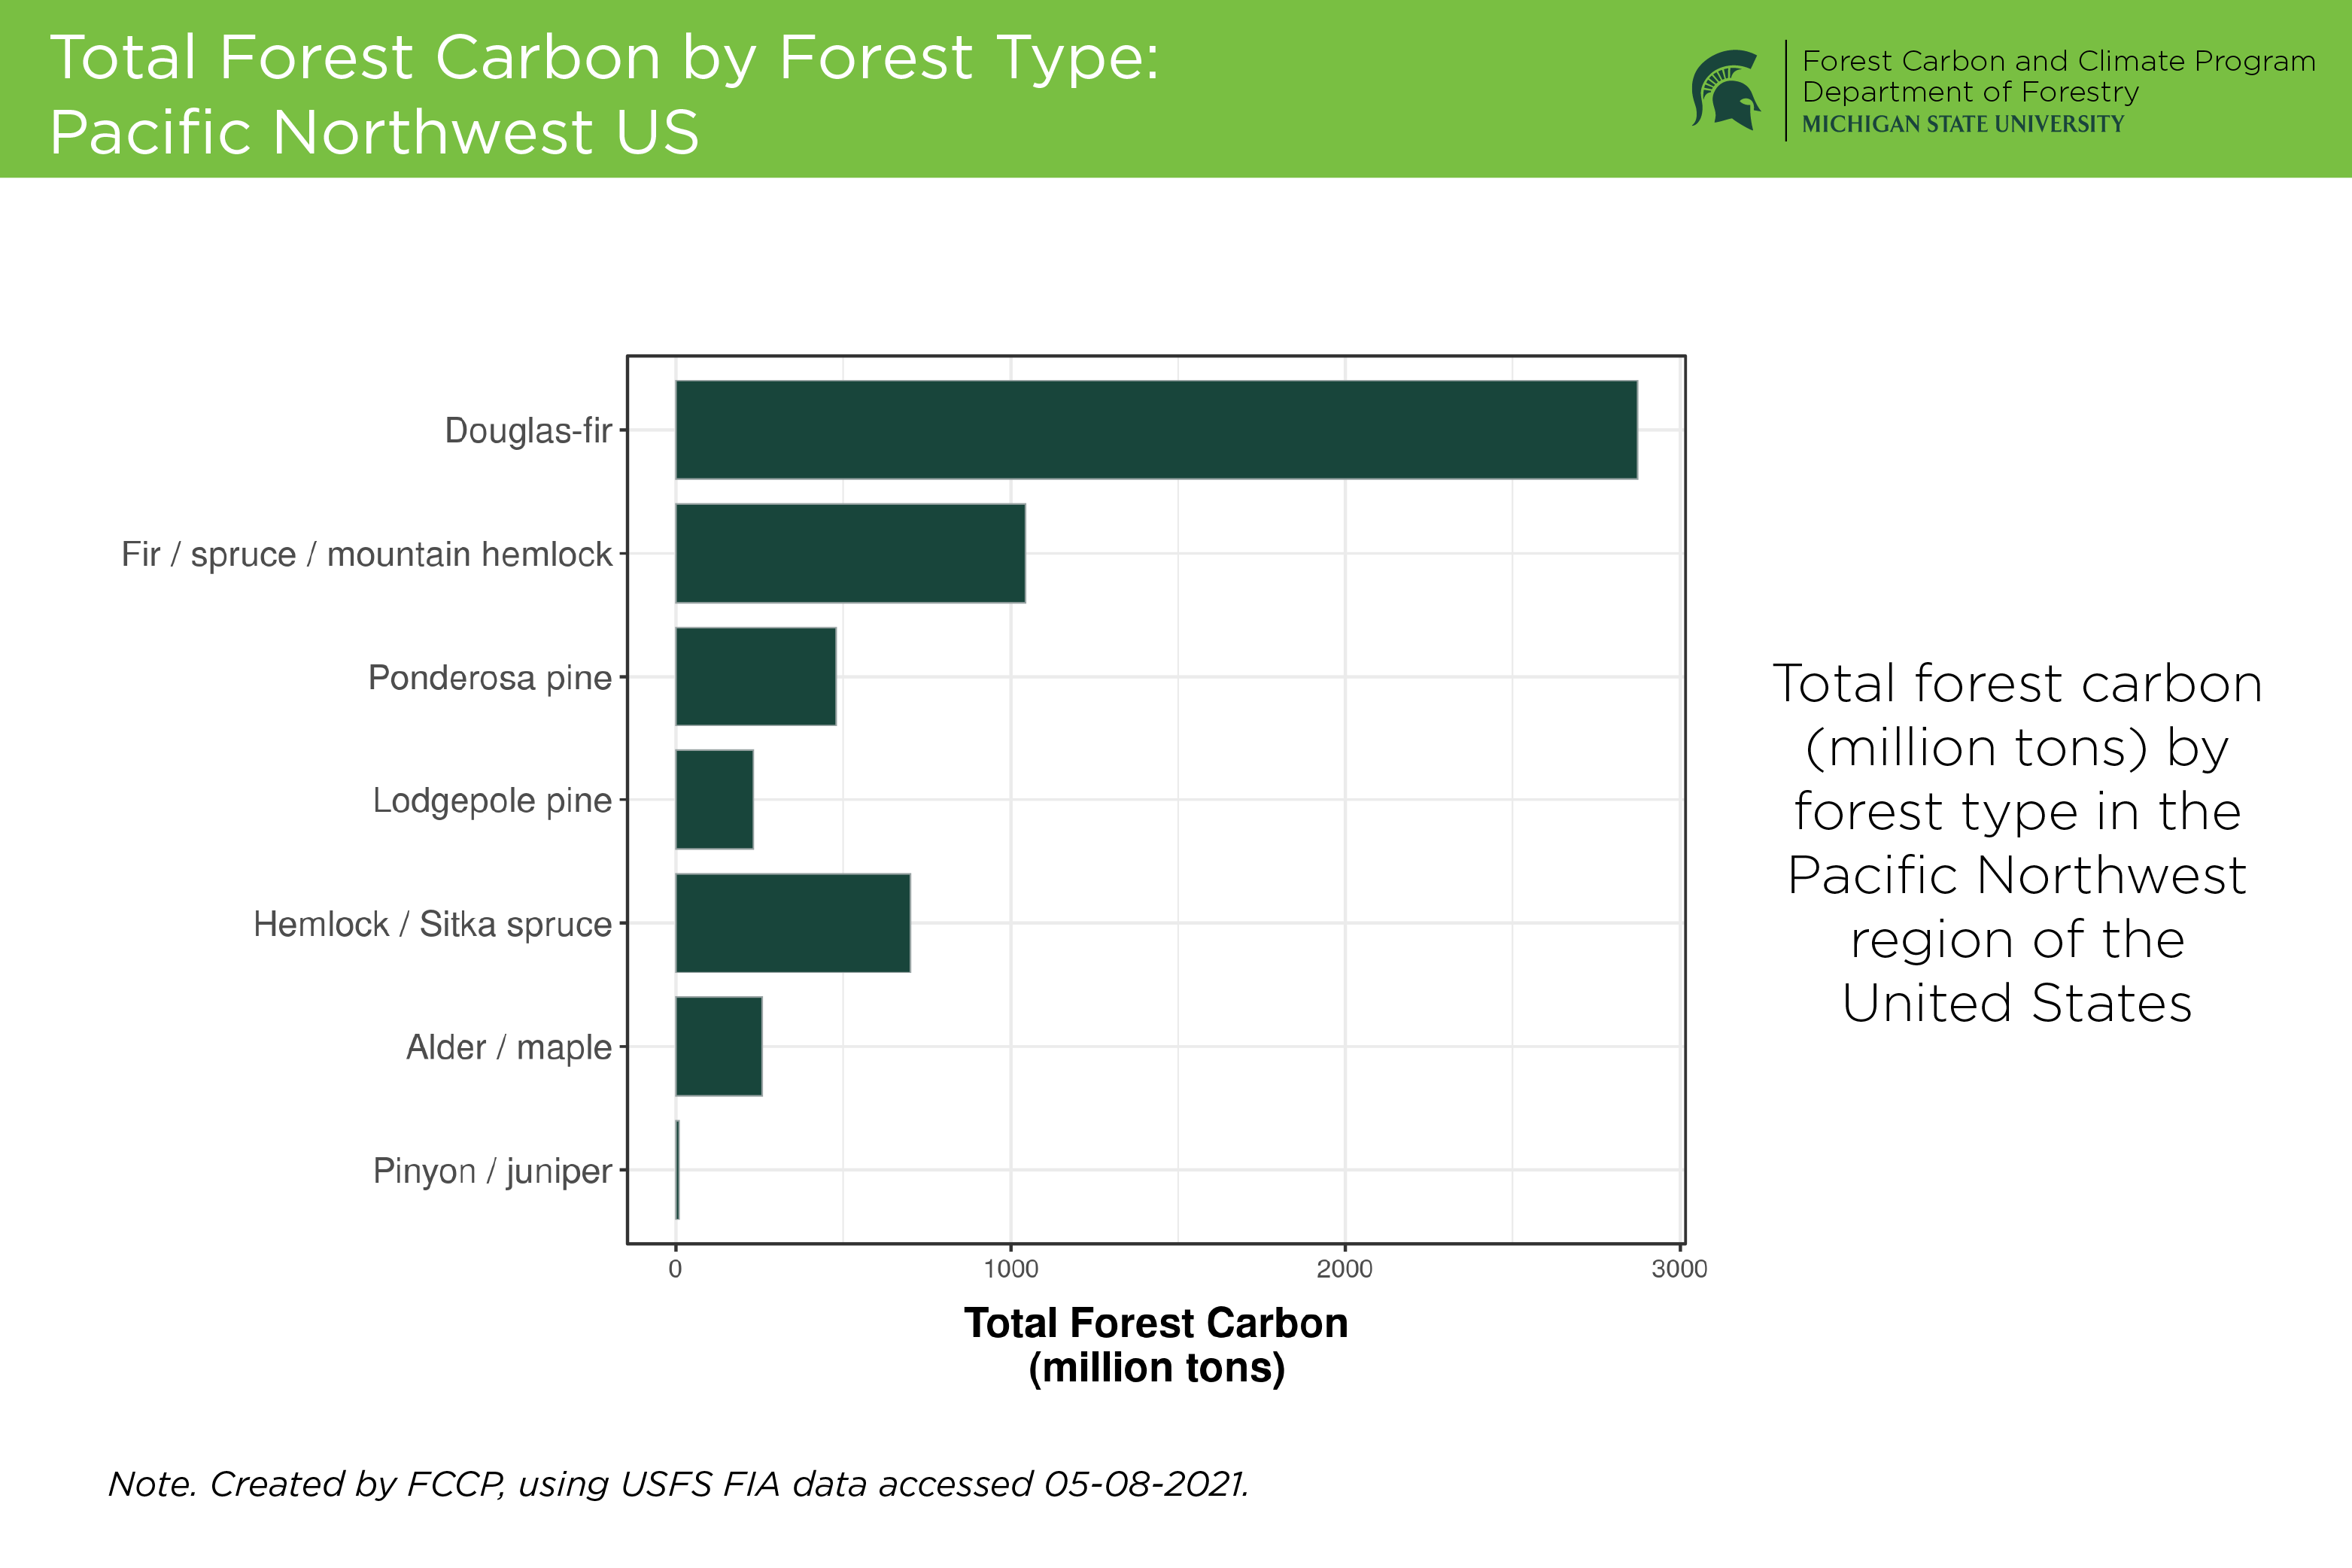
Total Forest Carbon by Forest Type: Pacific Northwest US
-
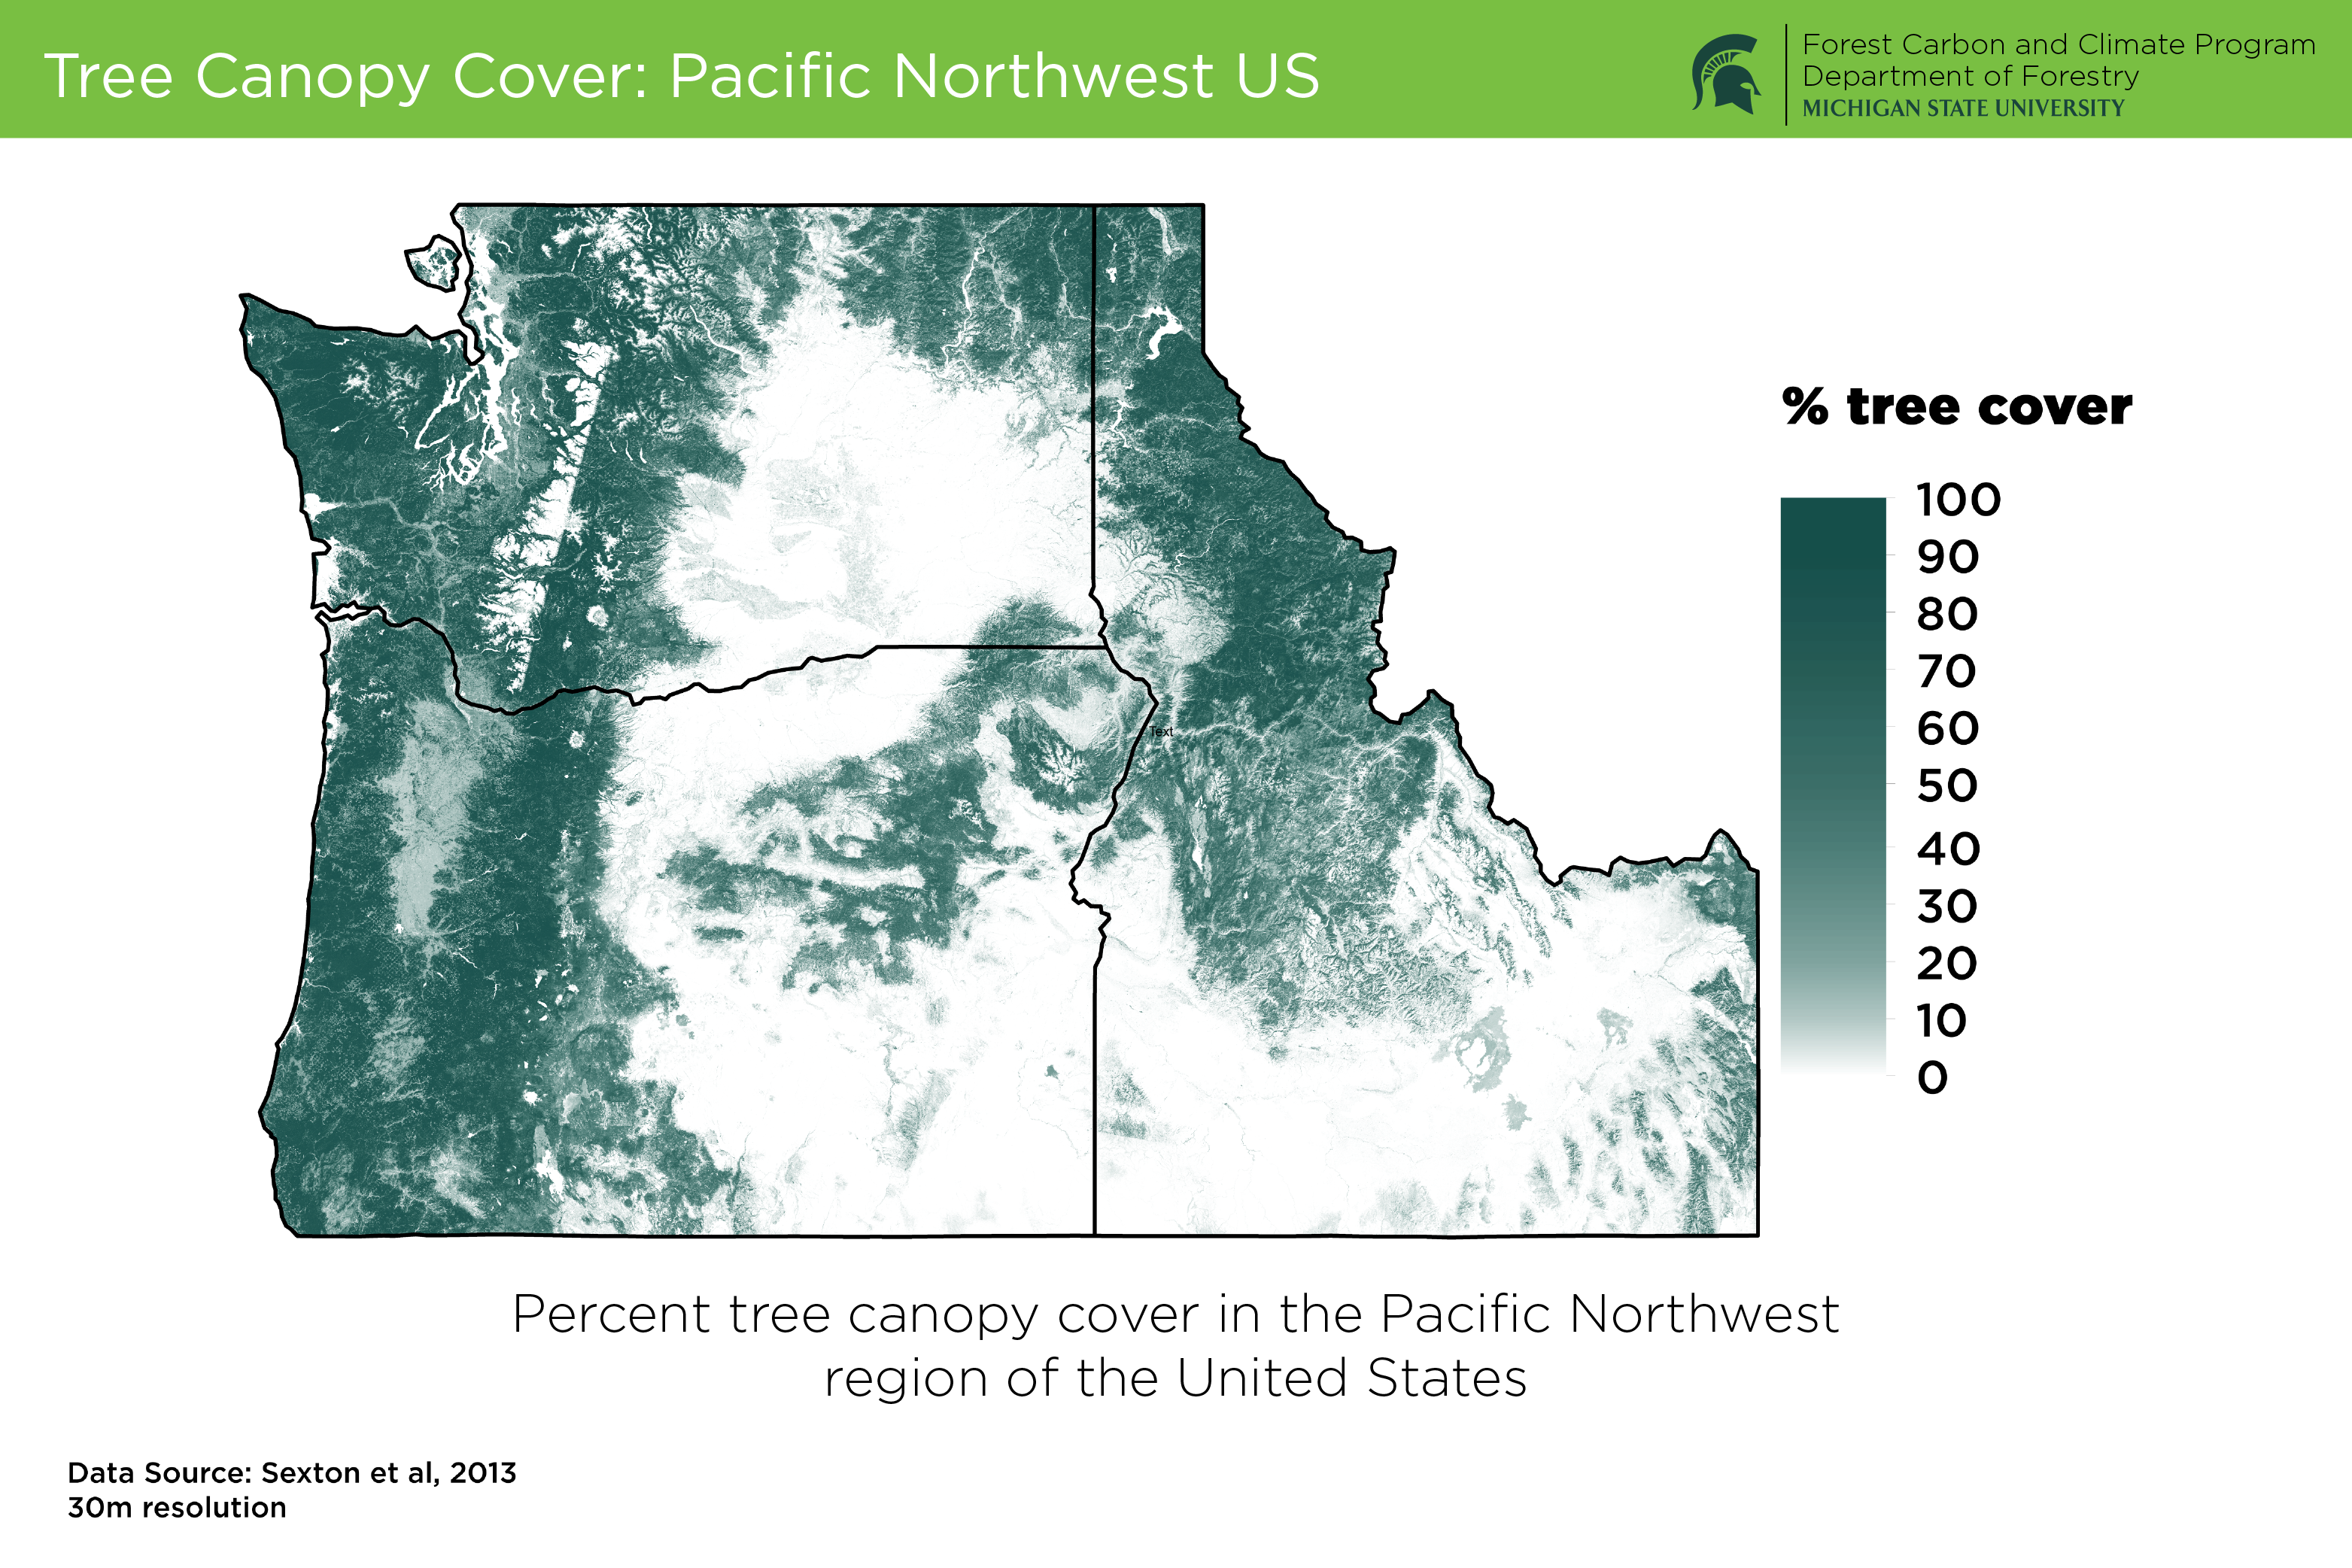
Tree Canopy Cover: Pacific Northwest US
-
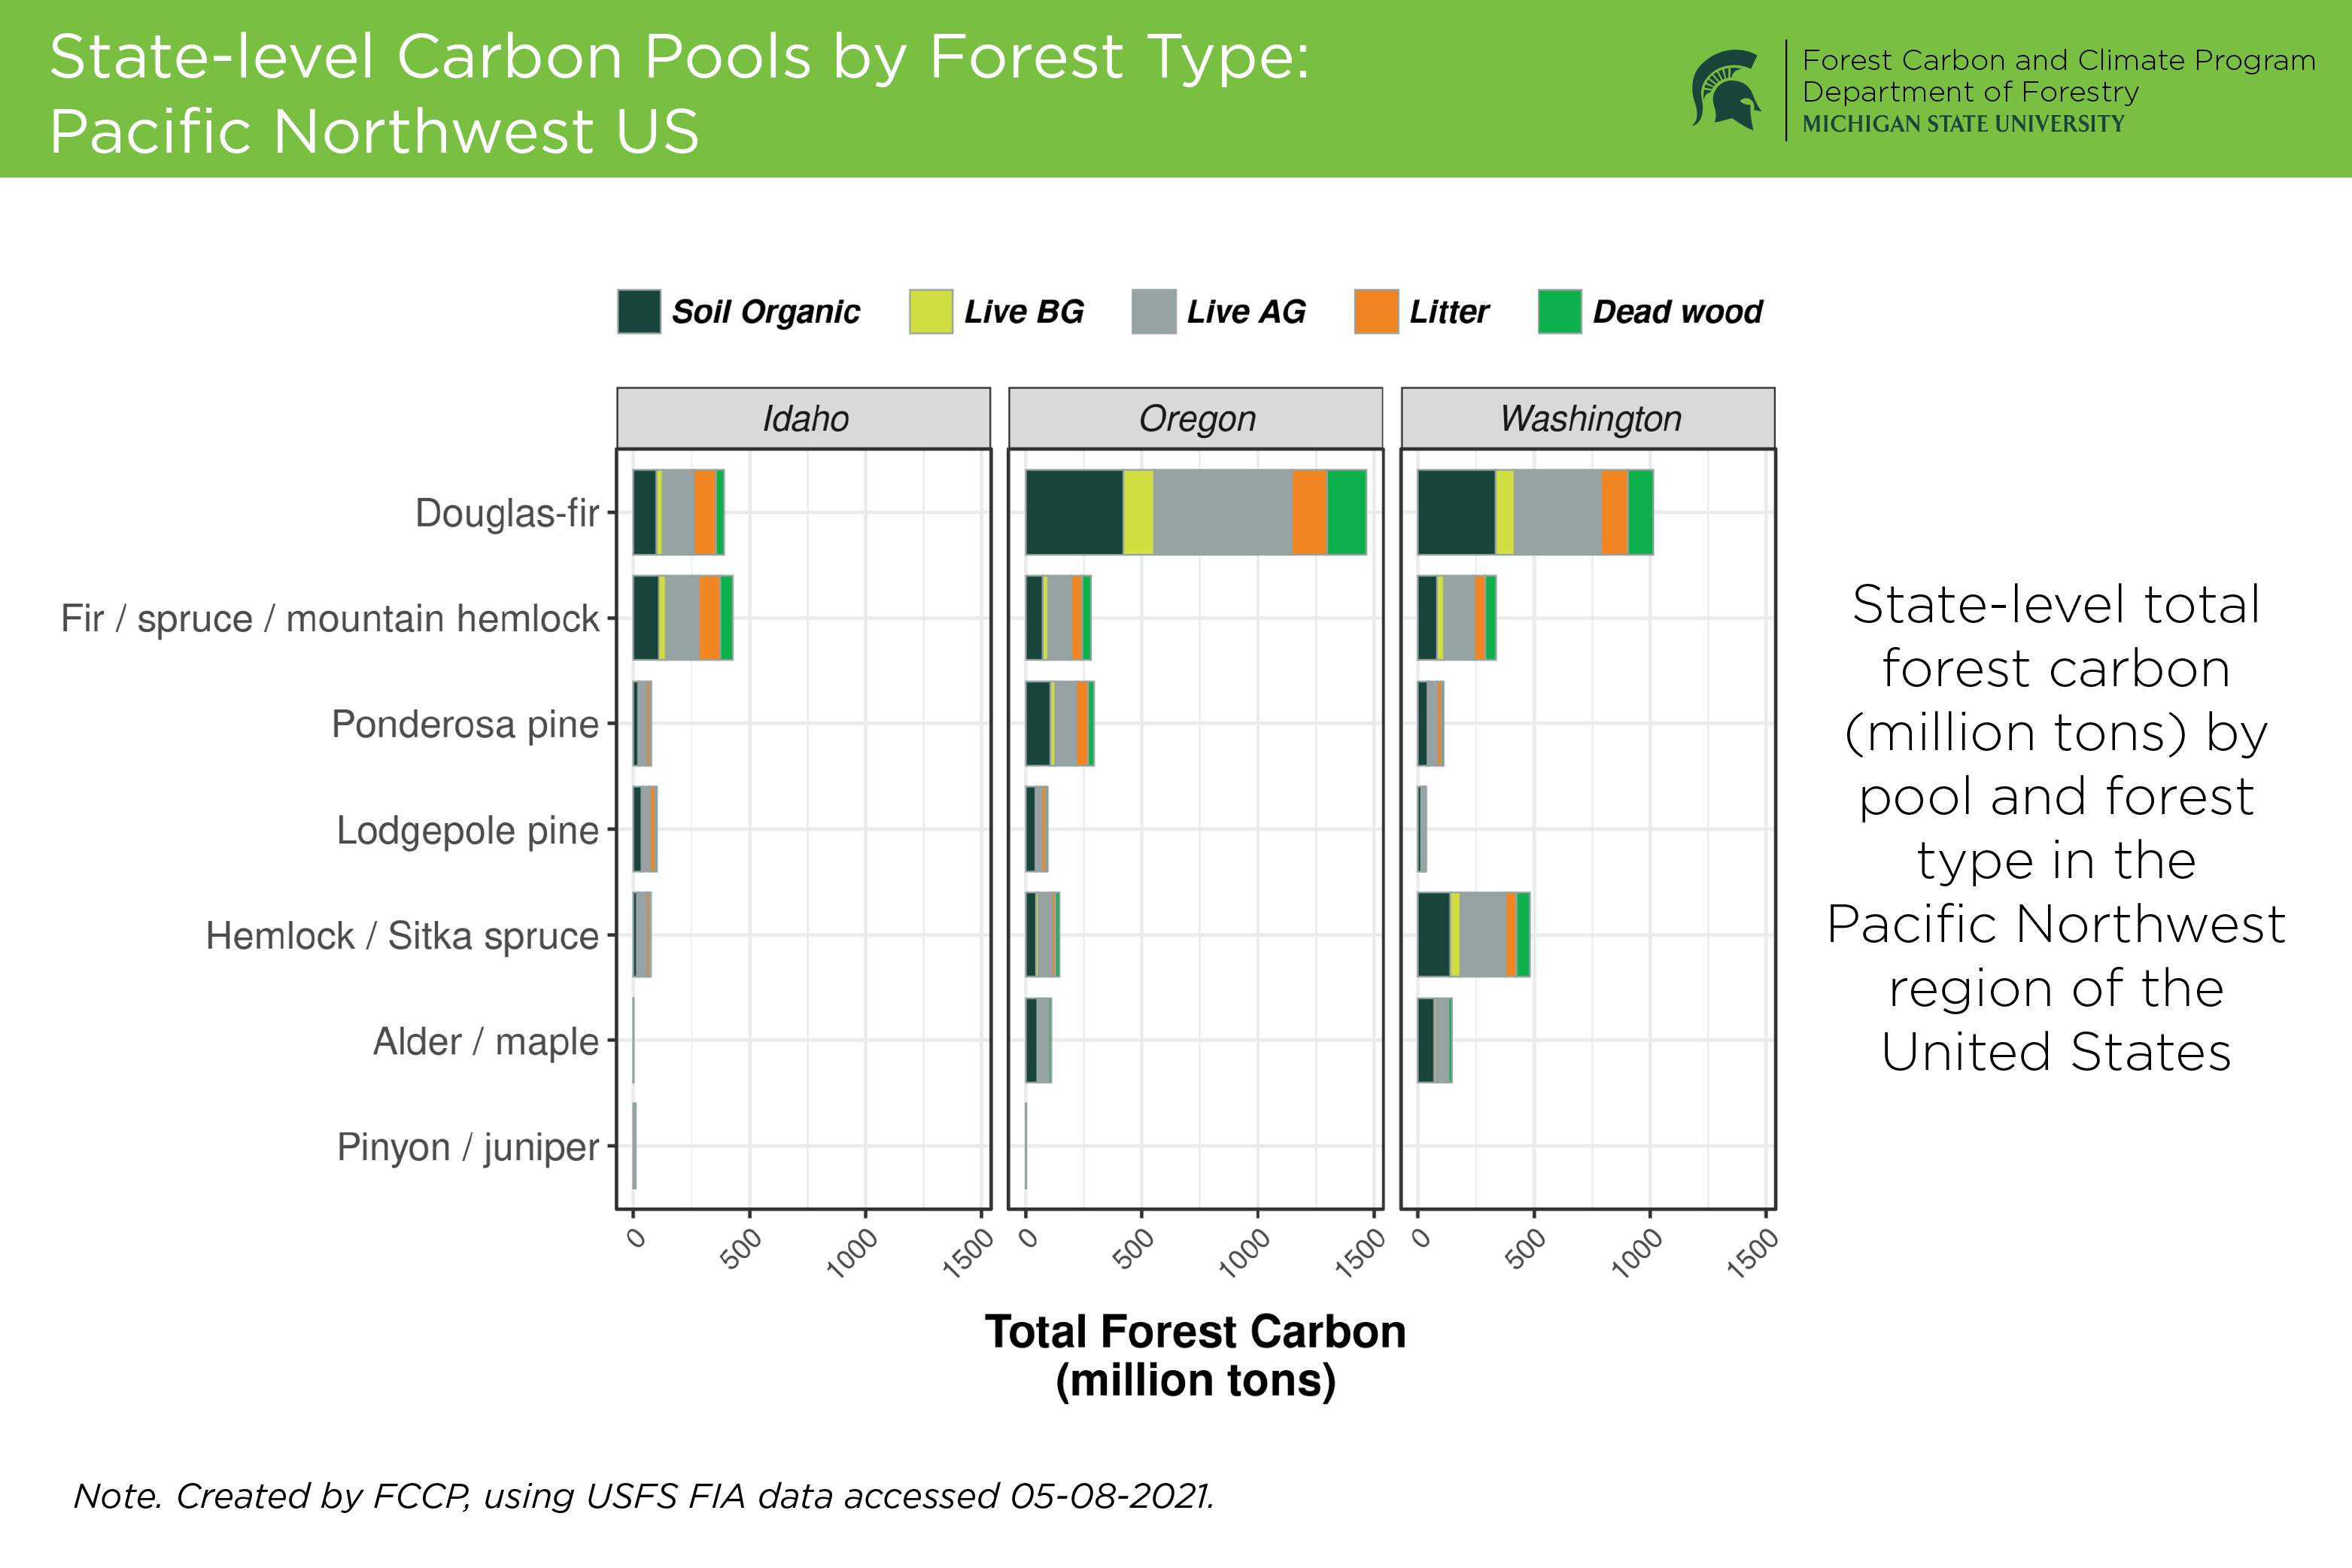
State-level Carbon Pools by Forest Type: Pacific Northwest US
.png)
 Print
Print Email
Email